
AWS / CloudWatch / MQ
RabbitMQ broker monitoring on Amazon MQ via CloudWatch SEARCH expressions. Pick a broker in the dropdown, then set Max Connections / Max Channels to match its instance class. Pre-set for a 3-node cluster (m7g.xlarge × 3 = 30,000 conn / 90,000 channels). The full lookup table is in the Connection/Channel Utilization gauge descriptions.
AWS Amazon MQ for RabbitMQ Monitoring Dashboard for Grafana - CloudWatch Metrics
A Grafana dashboard for monitoring AWS Amazon MQ (RabbitMQ) brokers using CloudWatch SEARCH expressions. Broker-wide overview plus per-node and per-queue drill-down for capacity utilization, resources, message throughput, and queue backlogs - built specifically for the metrics Amazon MQ exposes (not the raw RabbitMQ Management API).
Why monitor AWS Amazon MQ for RabbitMQ?
Amazon MQ failures usually look the same: a queue starts backing up because consumers crashed or slowed down; memory pressure rises as messages accumulate; the broker hits its connection or channel limit and refuses new clients; or replication lag between cluster nodes grows until the cluster goes into split-brain. This dashboard surfaces all of those signals using only what CloudWatch publishes - no need to expose the RabbitMQ Management UI or run a Prometheus exporter inside the broker.
It uses CloudWatch SEARCH expressions to discover queues and nodes automatically, so you don't have to enumerate them in the dashboard.
Features
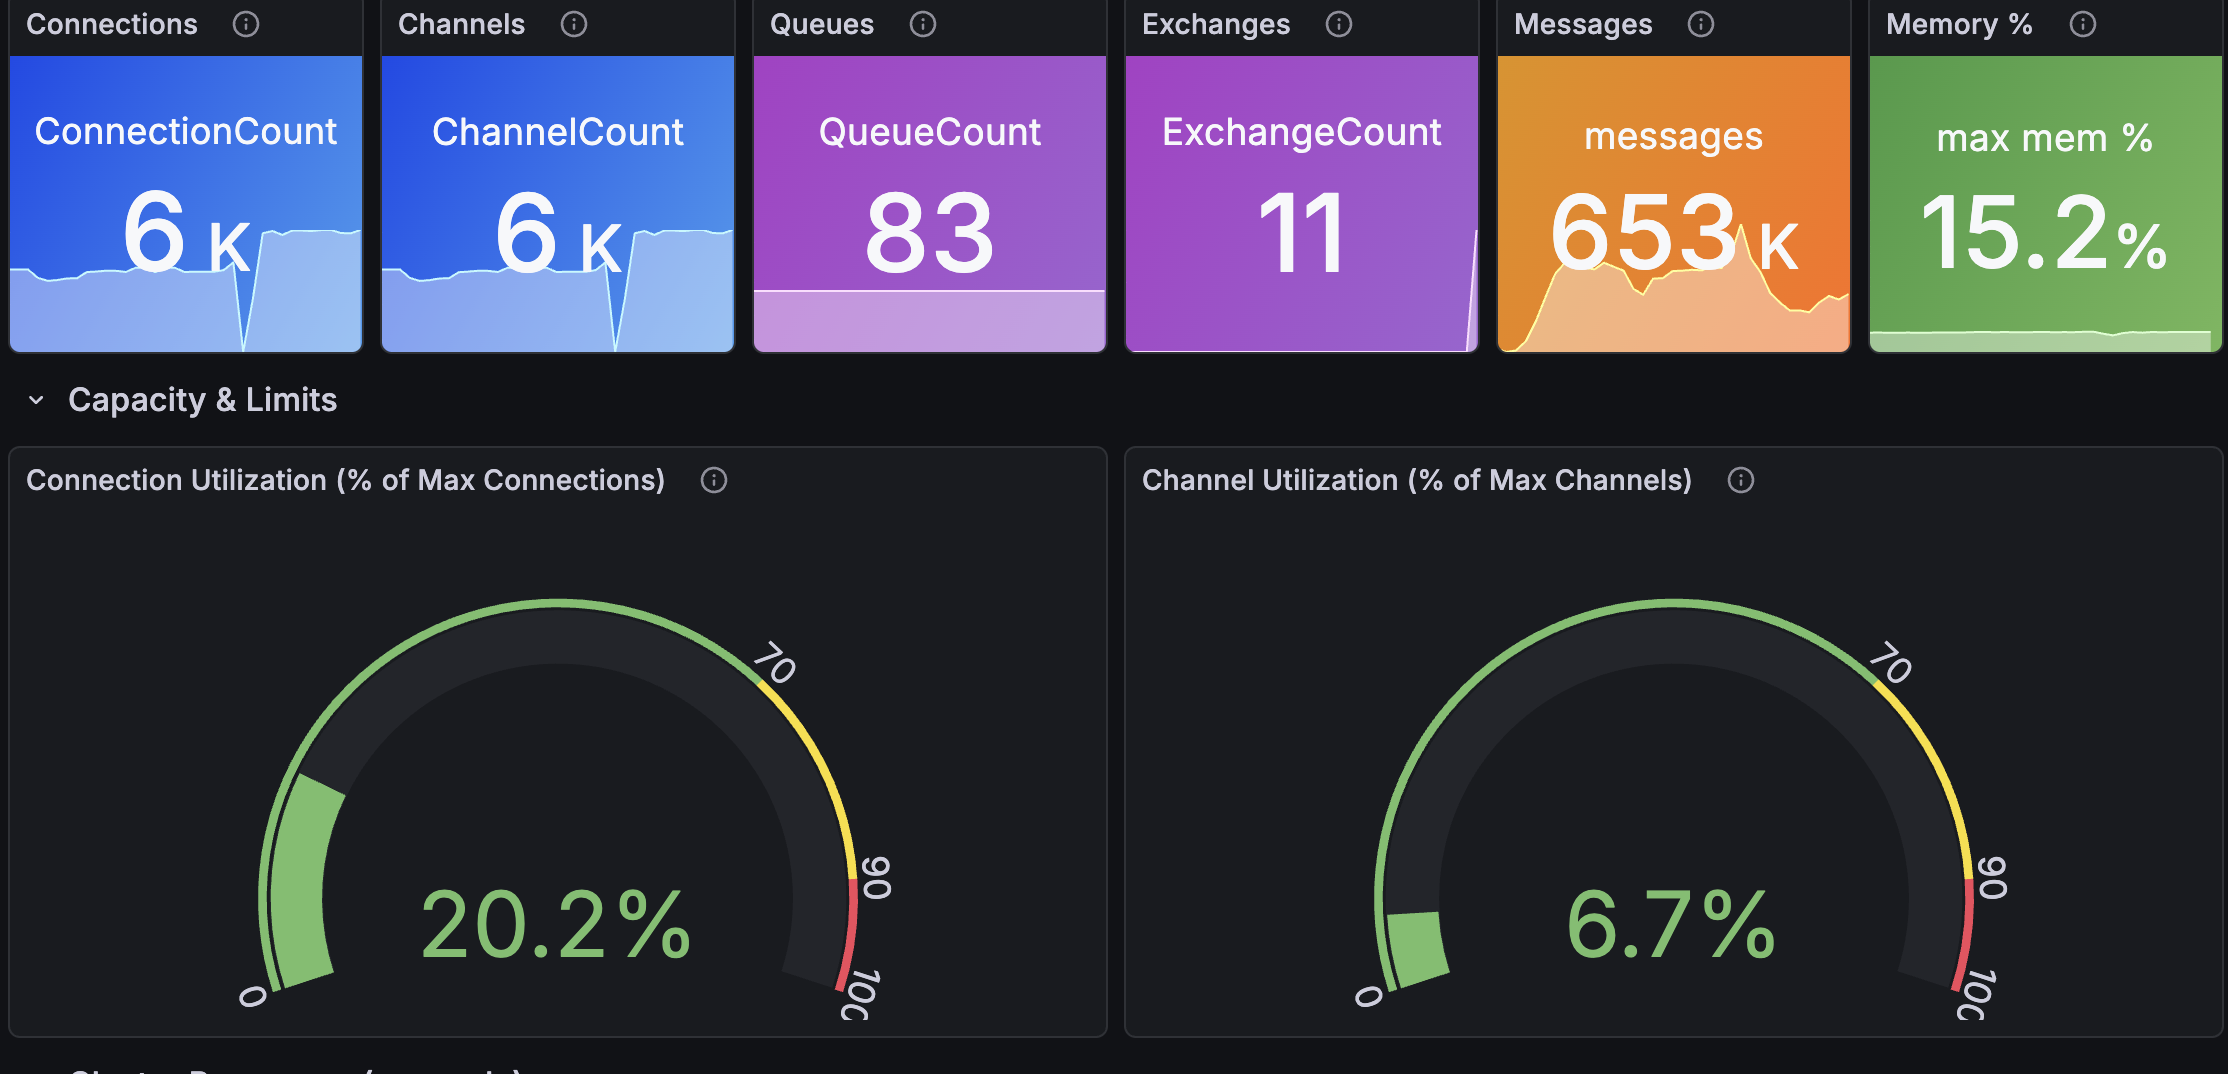
- Health overview - total connections, channels, queues, exchanges, messages, worst-node memory %
- Capacity and limits - connection and channel utilization gauges as % of configurable limit (with full per-instance-class lookup table in the panel descriptions)
- Cluster resources per node - System CPU, memory used vs limit, disk free vs disk low watermark, open file descriptors
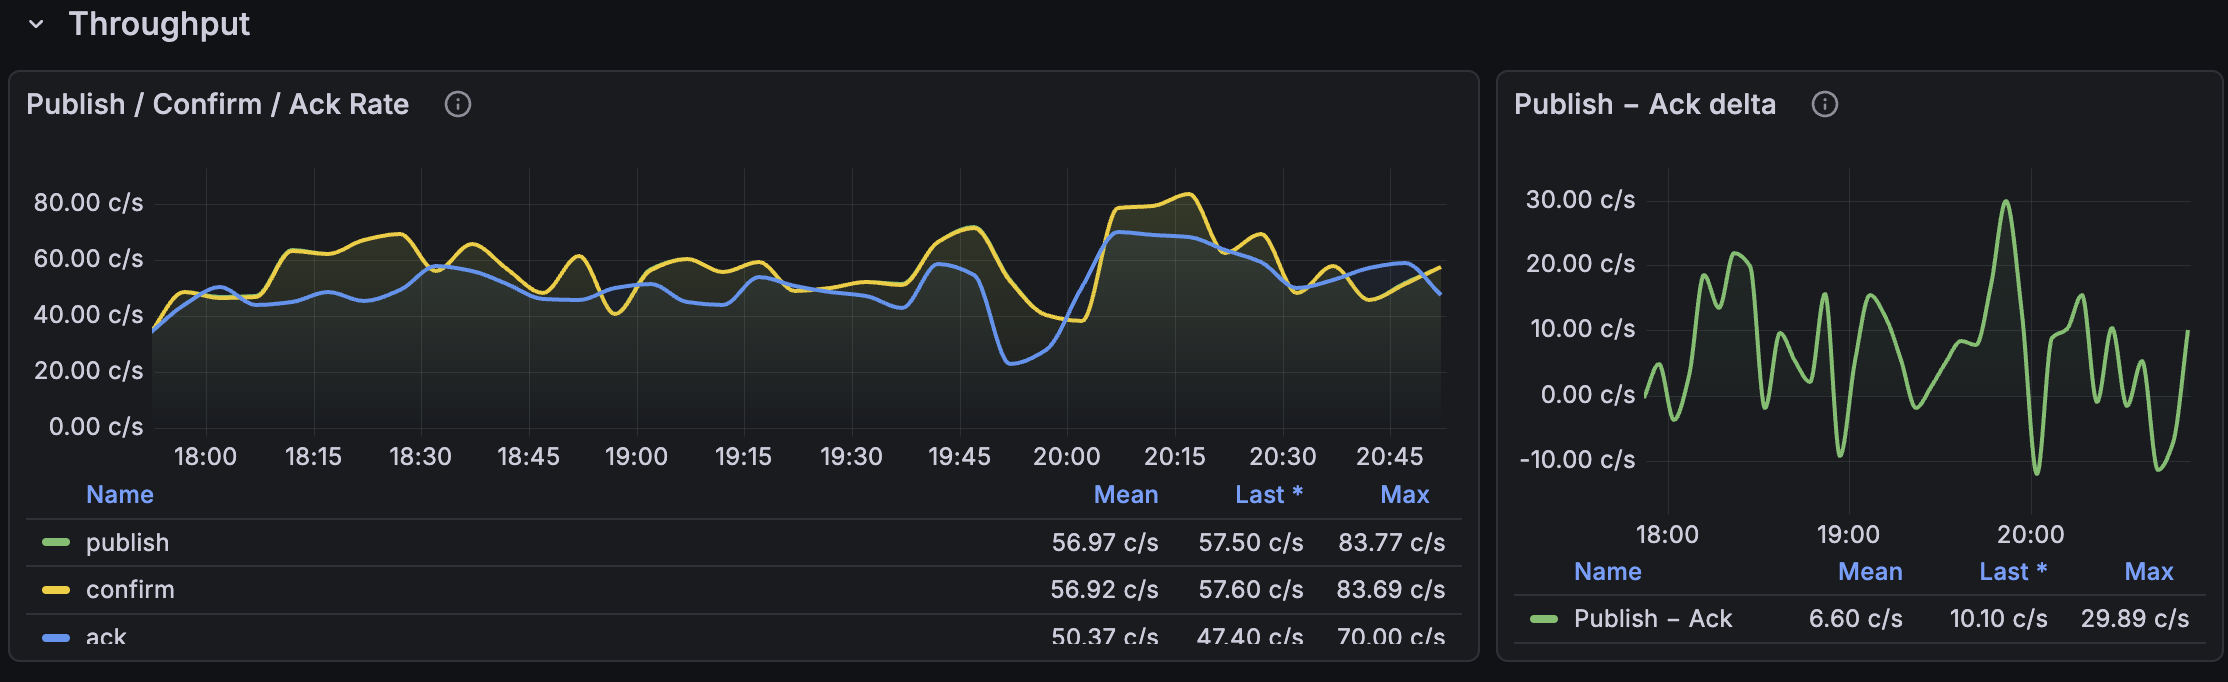
- Throughput - broker-wide publish, confirm, and ack rates, plus a publish−ack delta panel that goes positive when backlog is growing
- Queue backlogs - top 15 queues by
MessageReadyCount, top 15 byMessageUnacknowledgedCount, and aggregate ready vs unacked across the entire broker - Single queue detail - selected queue's message counts (total / ready / unacked) and consumer count over time
Capacity Limits by Instance Class
Amazon MQ enforces per-node limits on connections and channels by instance class. The dashboard ships with a starter value (single mq.m7g.xlarge node = 10,000 connections / 30,000 channels) and a full lookup table in the gauge panel descriptions:
| Instance Class | Connections per node | Channels per node |
|---|---|---|
| mq.m7g.medium | 100 | 500 |
| mq.m7g.large | 5,000 | 15,000 |
| mq.m7g.xlarge | 10,000 | 30,000 |
| mq.m7g.2xlarge | 20,000 | 60,000 |
| mq.m7g.4xlarge | 40,000 | 120,000 |
Multiply by 3 for cluster totals. RabbitMQ enforces the per-node limit, not the cluster total - a single node hitting its limit will refuse new connections even if the cluster-wide count is well under capacity.
Key CloudWatch Metrics Used
All metrics are from the AWS/AmazonMQ namespace, dimensioned by Broker (and Node or Queue where applicable).
ConnectionCount, ChannelCount
Active AMQP client connections and open channels broker-wide. RabbitMQ supports up to 2,047 channels per connection (channel_max default); the broker-wide ceiling is set by instance class.
QueueCount, ExchangeCount, MessageCount
Total declared queues, declared exchanges (including default and system exchanges), and messages aggregated across all queues.
RabbitMQMemUsed, RabbitMQMemLimit
Per-node memory used and configured limit. When used approaches limit, RabbitMQ enters memory alarm state and blocks publishers.
RabbitMQDiskFree, RabbitMQDiskFreeLimit
Per-node disk free and low-disk threshold. If free descends toward the limit, publishing on persistent queues blocks.
SystemCpuUtilization, RabbitMQFdUsed
Per-node CPU and open file descriptor count.
PublishRate, ConfirmRate, AckRate
Broker-wide message rates. Sustained PublishRate - AckRate > 0 means consumers can't keep up with publishers - the backlog is growing.
MessageReadyCount, MessageUnacknowledgedCount
Per-queue counts of messages waiting for delivery and messages delivered but not yet acked. Sustained high MessageReadyCount = consumer shortage; sustained high MessageUnacknowledgedCount = slow or stuck consumers, or aggressive prefetch.
ConsumerCount
Per-queue consumer count. Drops to 0 while message count grows = consumer outage on that queue.
Prerequisites
- Grafana 10.0 or later
- AWS CloudWatch datasource plugin configured in Grafana
- IAM permissions on the role/user backing the datasource:
cloudwatch:GetMetricDatacloudwatch:ListMetricscloudwatch:GetMetricStatistics
No Amazon MQ permissions are required since metrics flow through CloudWatch.
Installation
- Download the dashboard JSON.
- In Grafana, go to Dashboards → New → Import.
- Paste the JSON or upload the file.
- When prompted, select your AWS CloudWatch datasource.
- Click Import.
- Adjust the "Max Connections" and "Max Channels" textboxes at the top of the dashboard to match your broker's instance class (see lookup table above).
Variables
- Region - AWS region of your broker
- Broker - auto-populated from CloudWatch with every broker that publishes metrics
- Node - node within the selected broker
- Virtual Host - vhost within the selected broker
- Queue - queue within the selected broker (drives the Single Queue Detail panels)
- Max Connections / Max Channels - textboxes for capacity limits; set per your instance class
Troubleshooting
Q: The Connection Utilization gauge is showing 200%. A: The Max Connections textbox is set too low. Update it to match your instance class - see the lookup table in the panel description.
Q: Memory % goes above 100% sometimes.
A: The calculation is MAX(MemUsed) / MAX(MemLimit) * 100. Occasional spikes above 100% in 5-minute windows reflect the broker briefly using burst memory; sustained above 100% means a memory alarm.
Q: Per-queue panels are empty for some queues. A: Amazon MQ only publishes per-queue metrics for queues that have had activity recently. Idle queues won't appear.
Q: Does this work for ActiveMQ brokers too?
A: No - this dashboard is RabbitMQ-specific. ActiveMQ on Amazon MQ publishes different metrics (ActiveMQ.JobScheduler.Store, etc.).
Related AWS Documentation
- Monitoring Amazon MQ for RabbitMQ with CloudWatch
- Amazon MQ for RabbitMQ broker instance types
- Quotas in Amazon MQ for RabbitMQ
Tags
aws amazon-mq rabbitmq messaging cloudwatch monitoring aws-monitoring message-queue amqp broker-monitoring grafana-dashboard
Data source config
Collector config:
Upload an updated version of an exported dashboard.json file from Grafana
| Revision | Description | Created | |
|---|---|---|---|
| Download |

AWS

Easily visualize and alert on more than 60 Amazon Web Services (AWS) resources using the fully managed Grafana Cloud platform.
Learn more