
K3S cluster monitoring with node metrics
Monitors K3s cluster using Kube-Prometheus. Shows overall cluster CPU / Memory / Filesystem usage as well as individual pod, containers, systemd services statistics. Uses cAdvisor metrics + node metrics for top level stats. Origin from dashboard: 15282 (k8s-rke-cluster-monitoring), 8721(K8s RKE cluster monitoring) and will be compatible with k3s
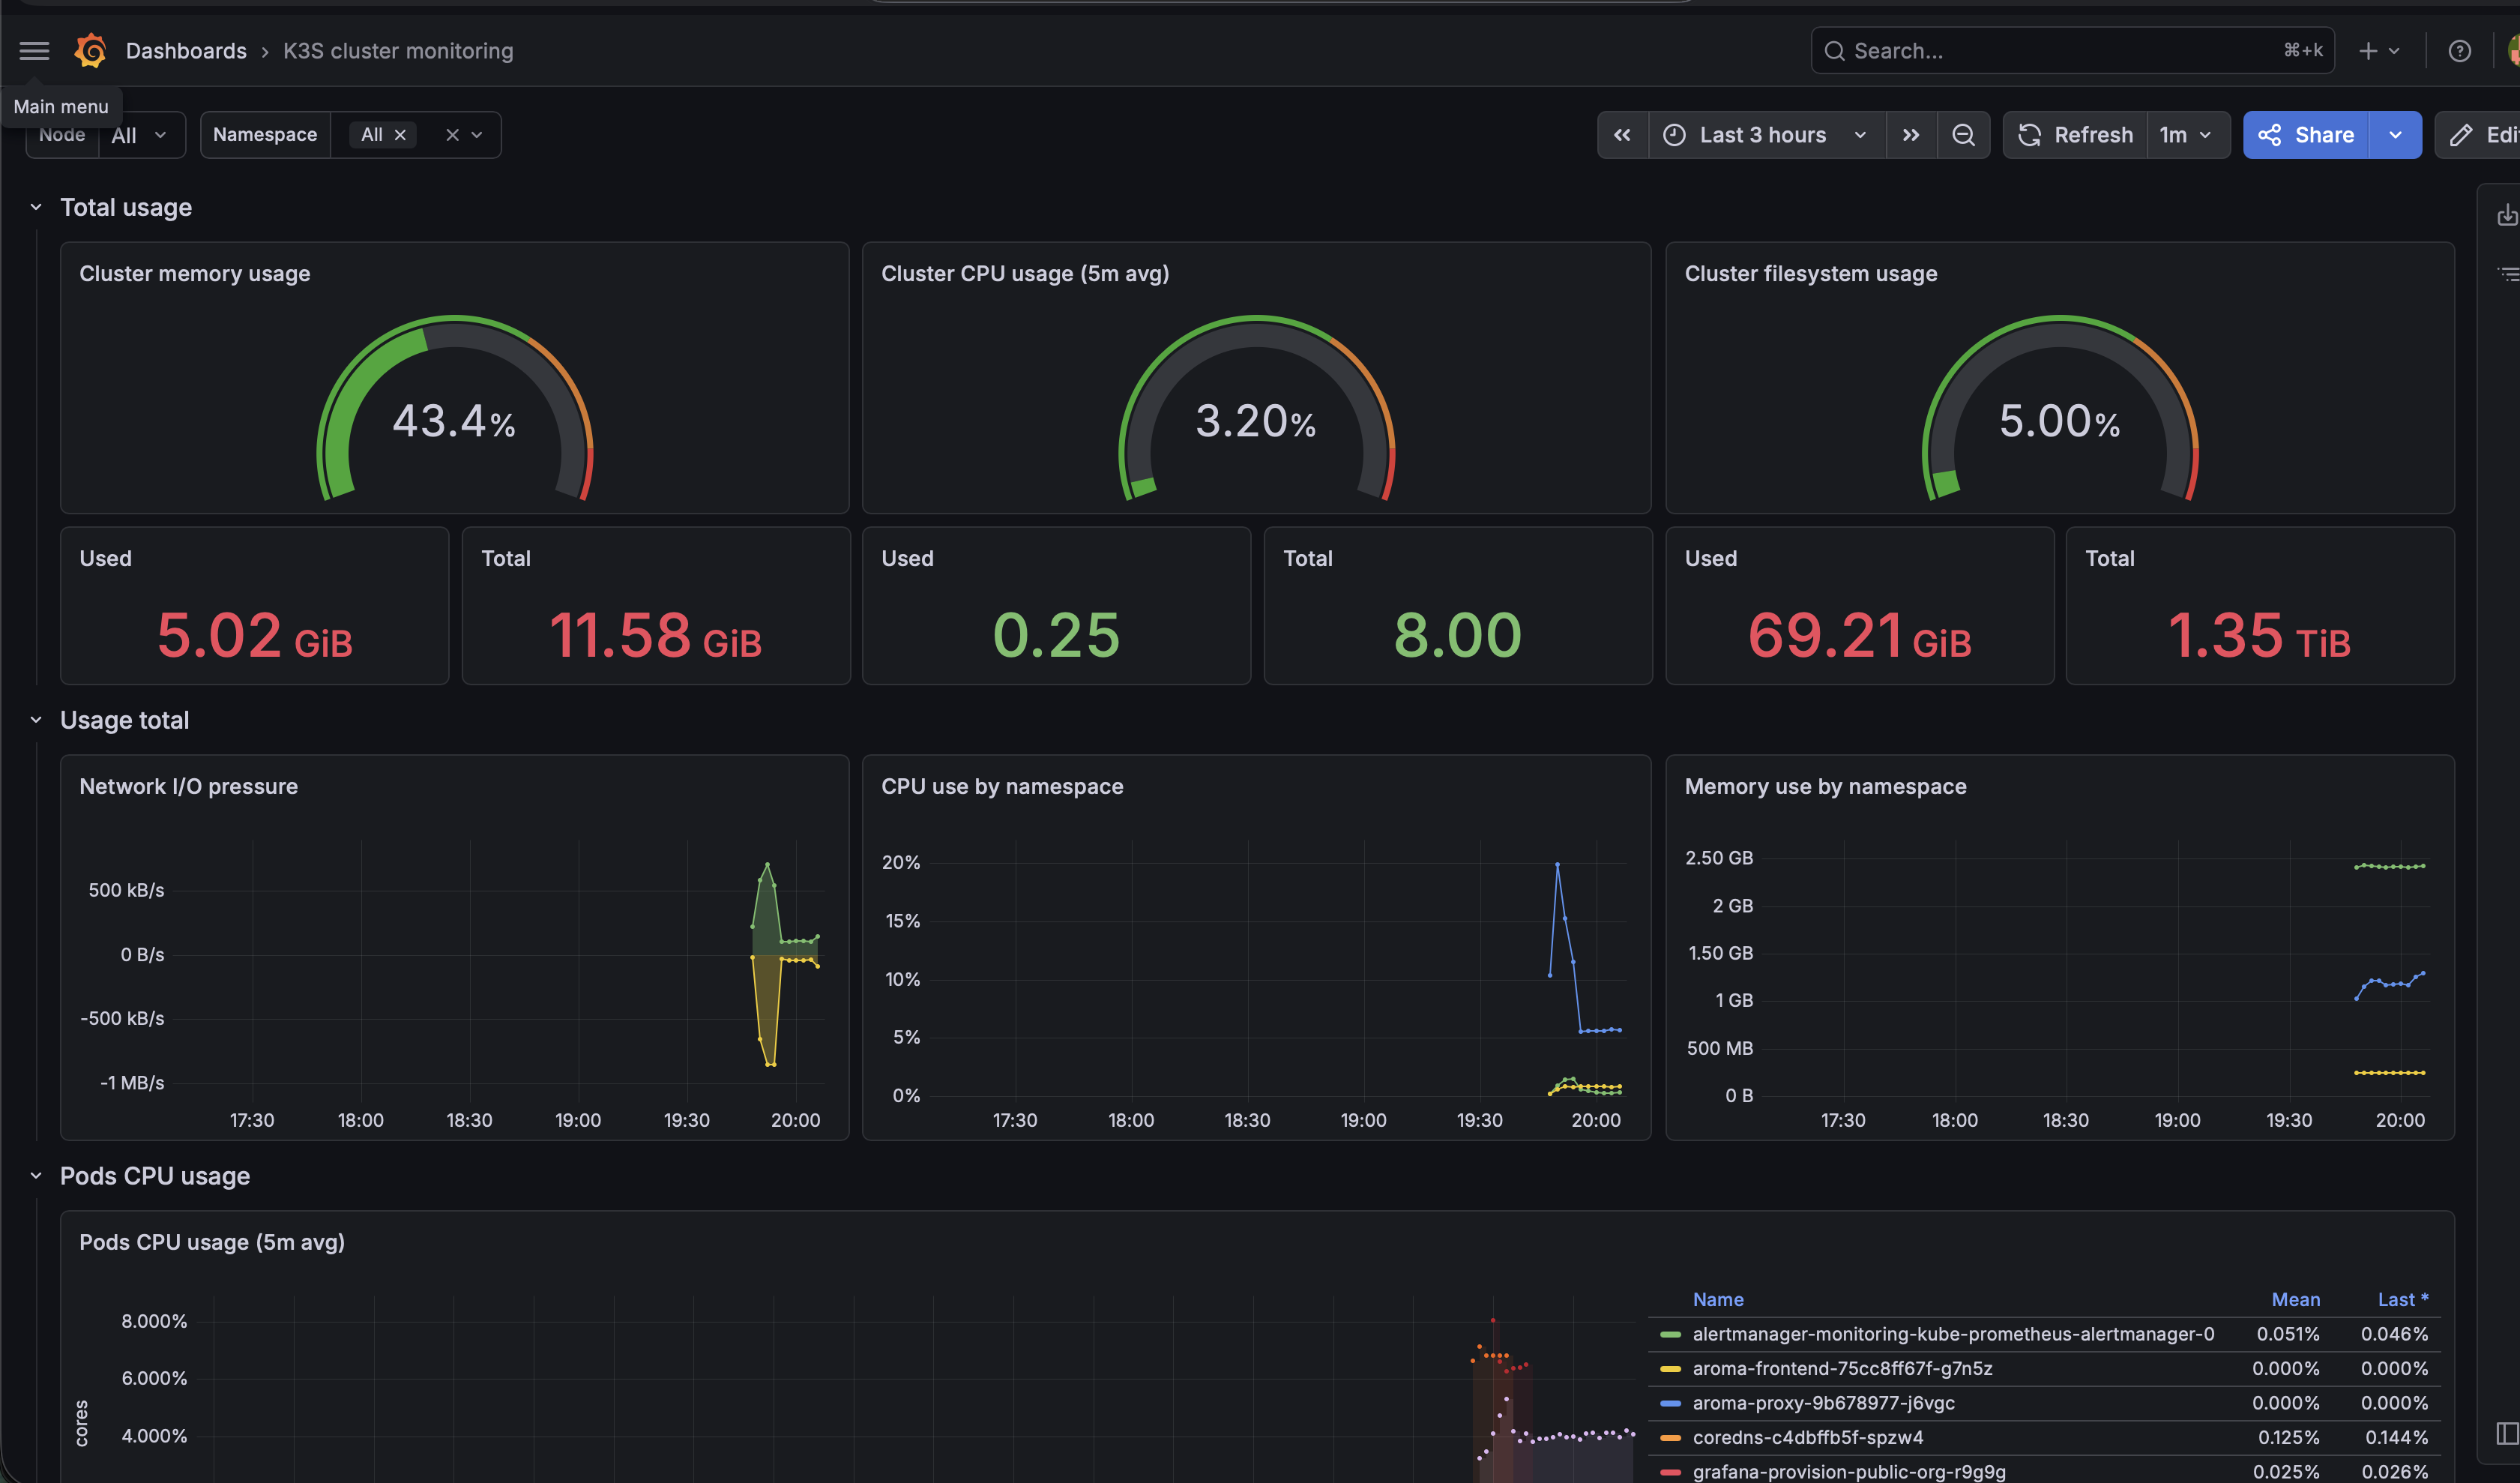
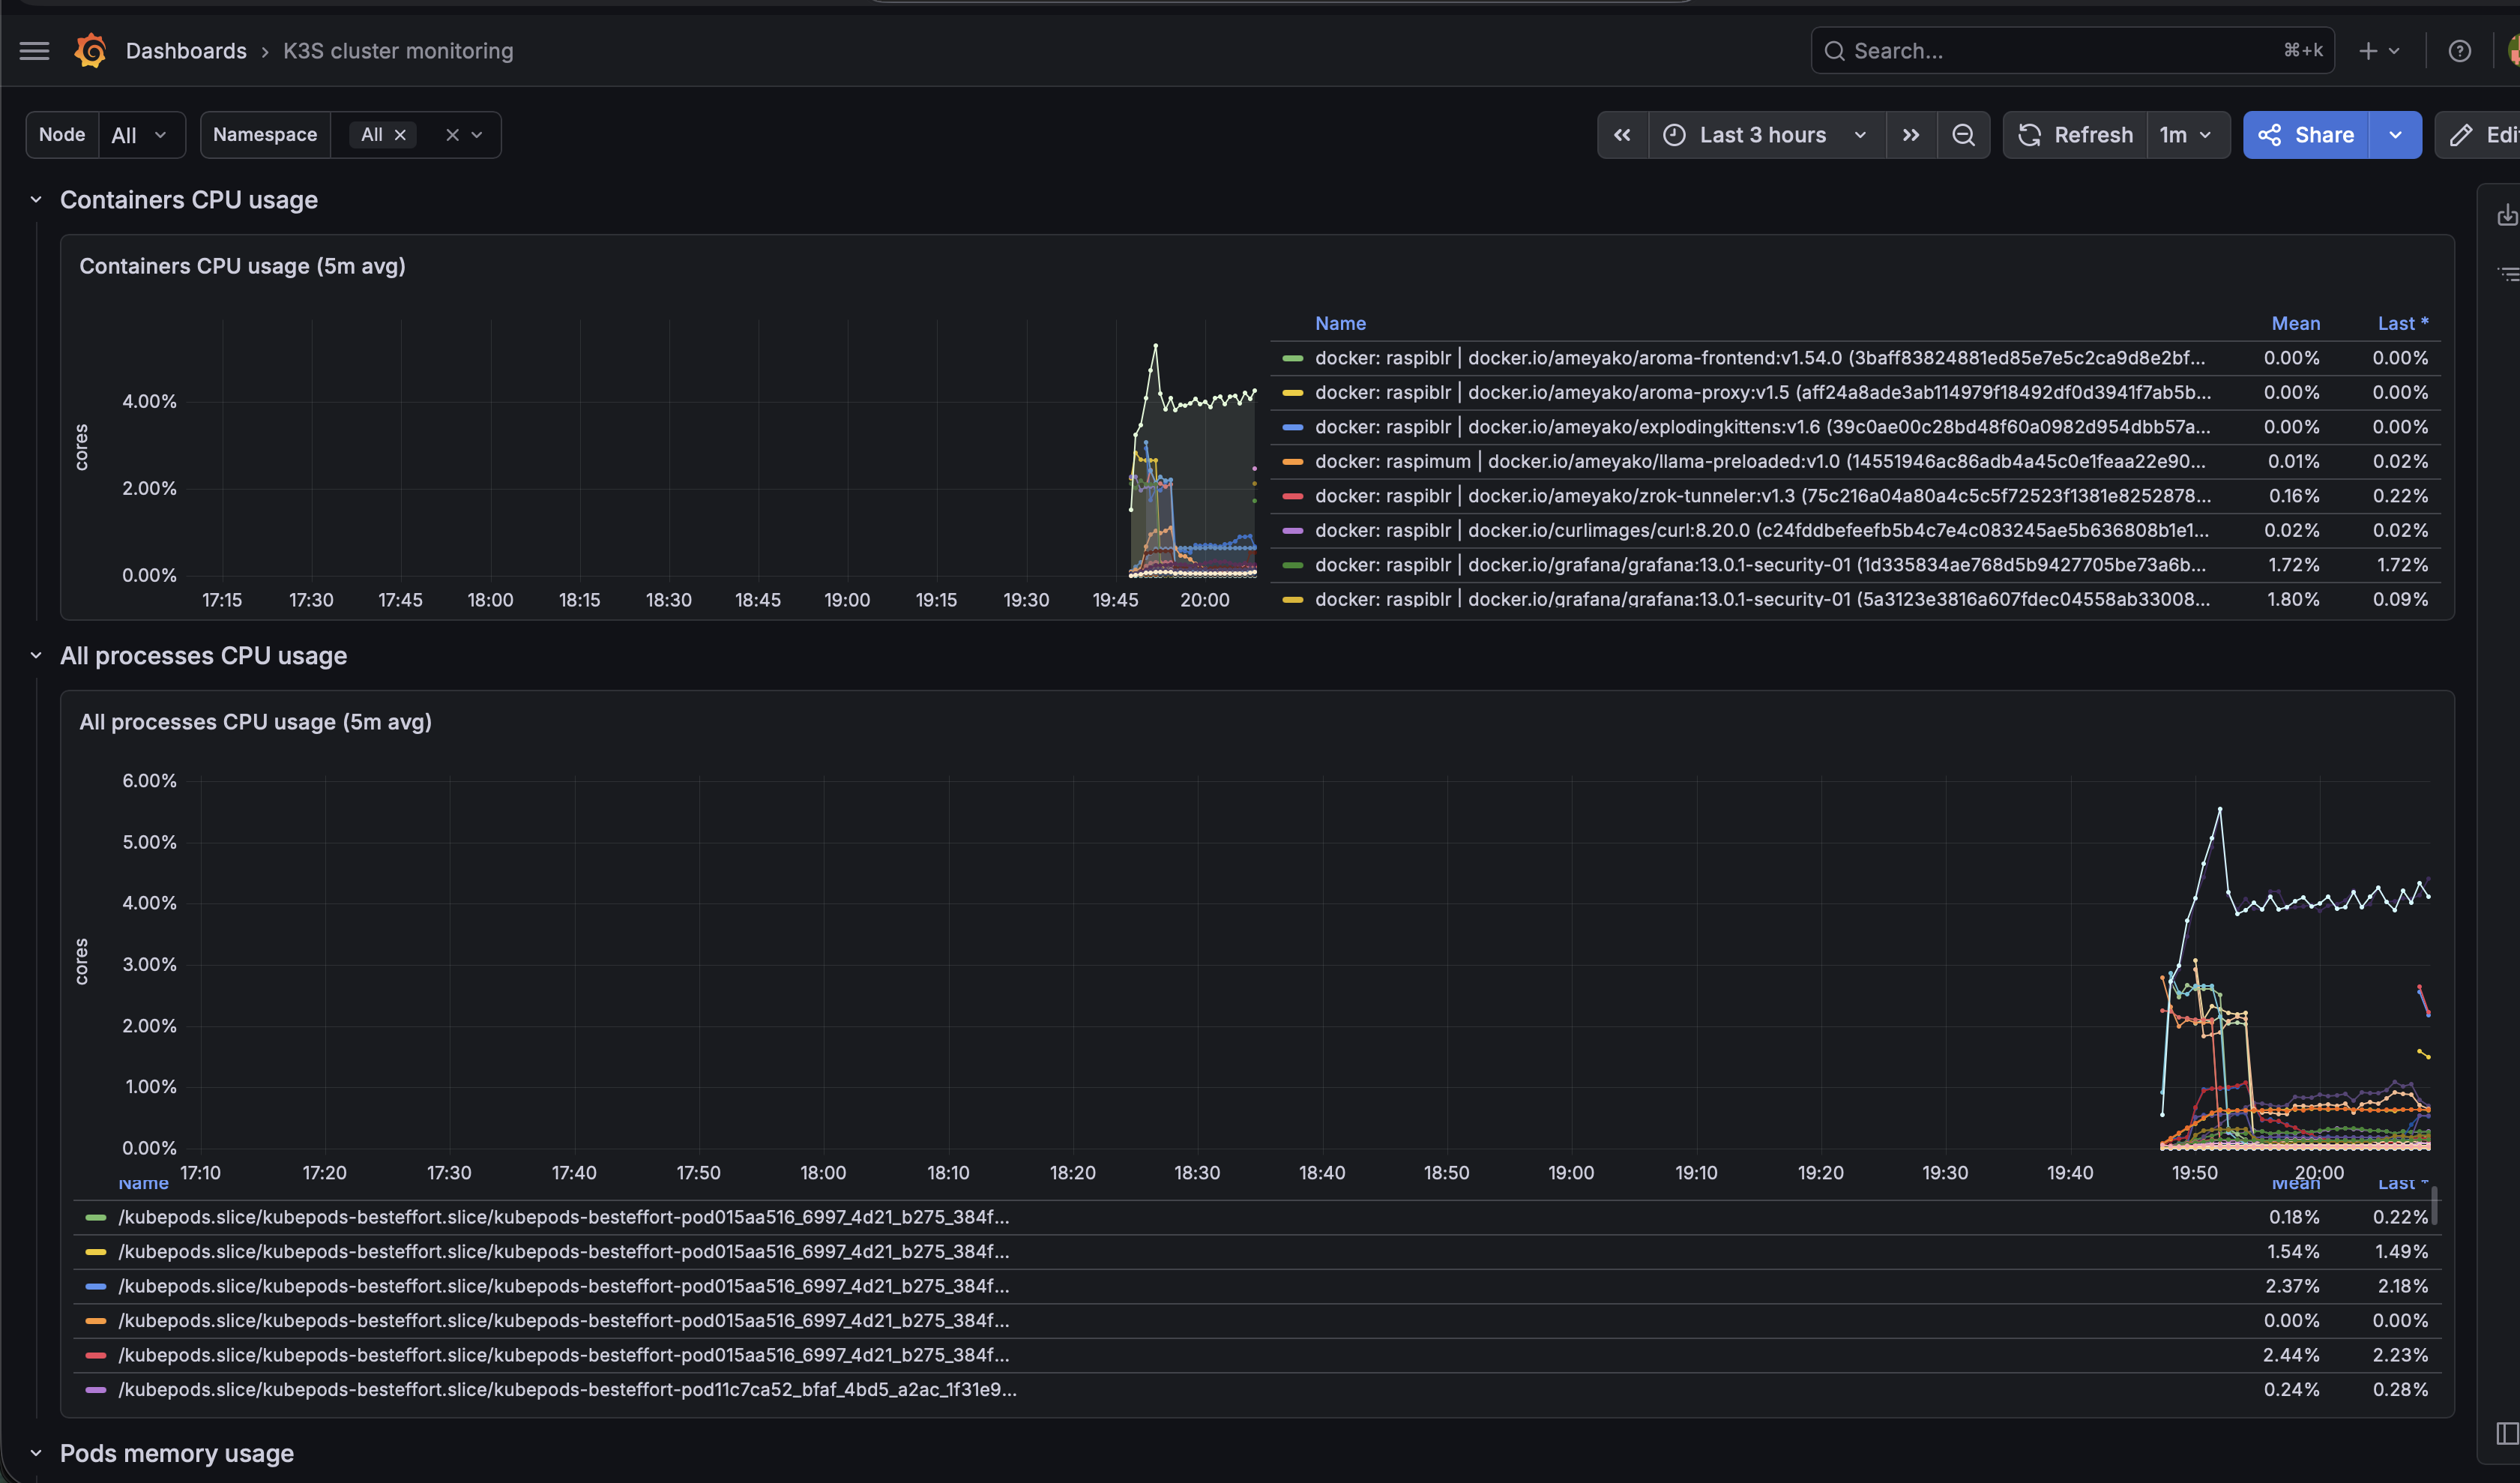
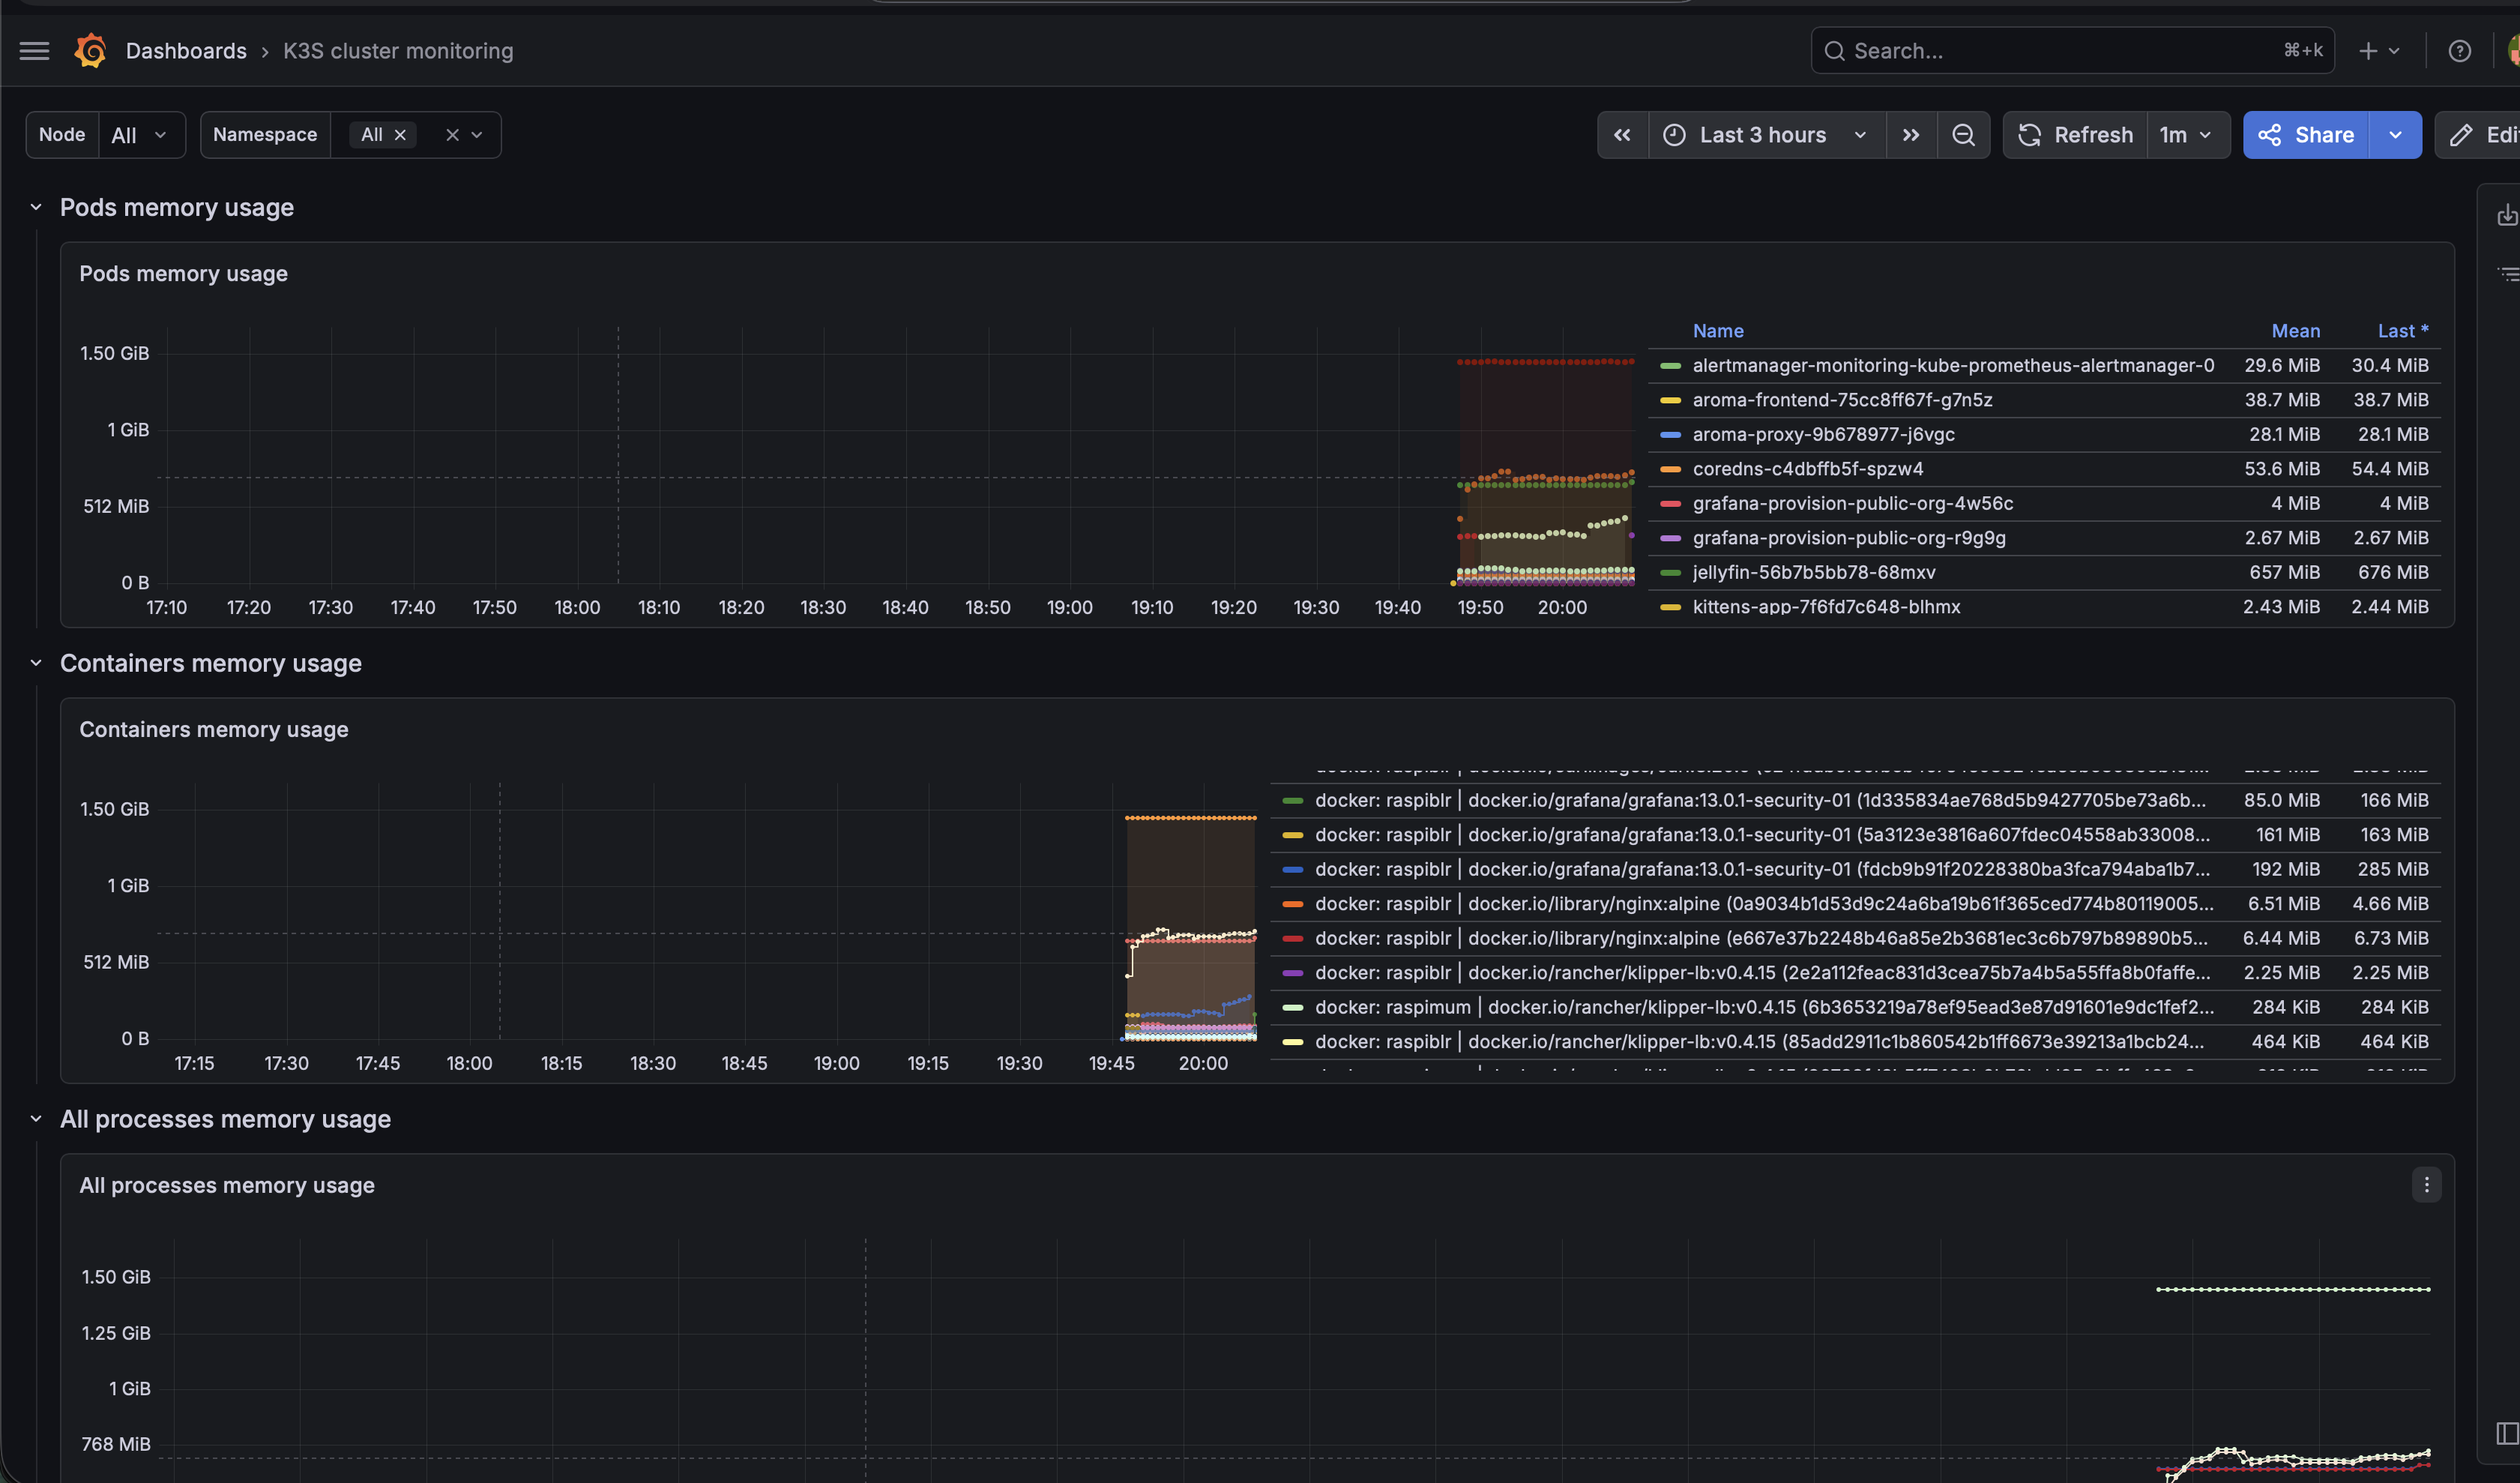
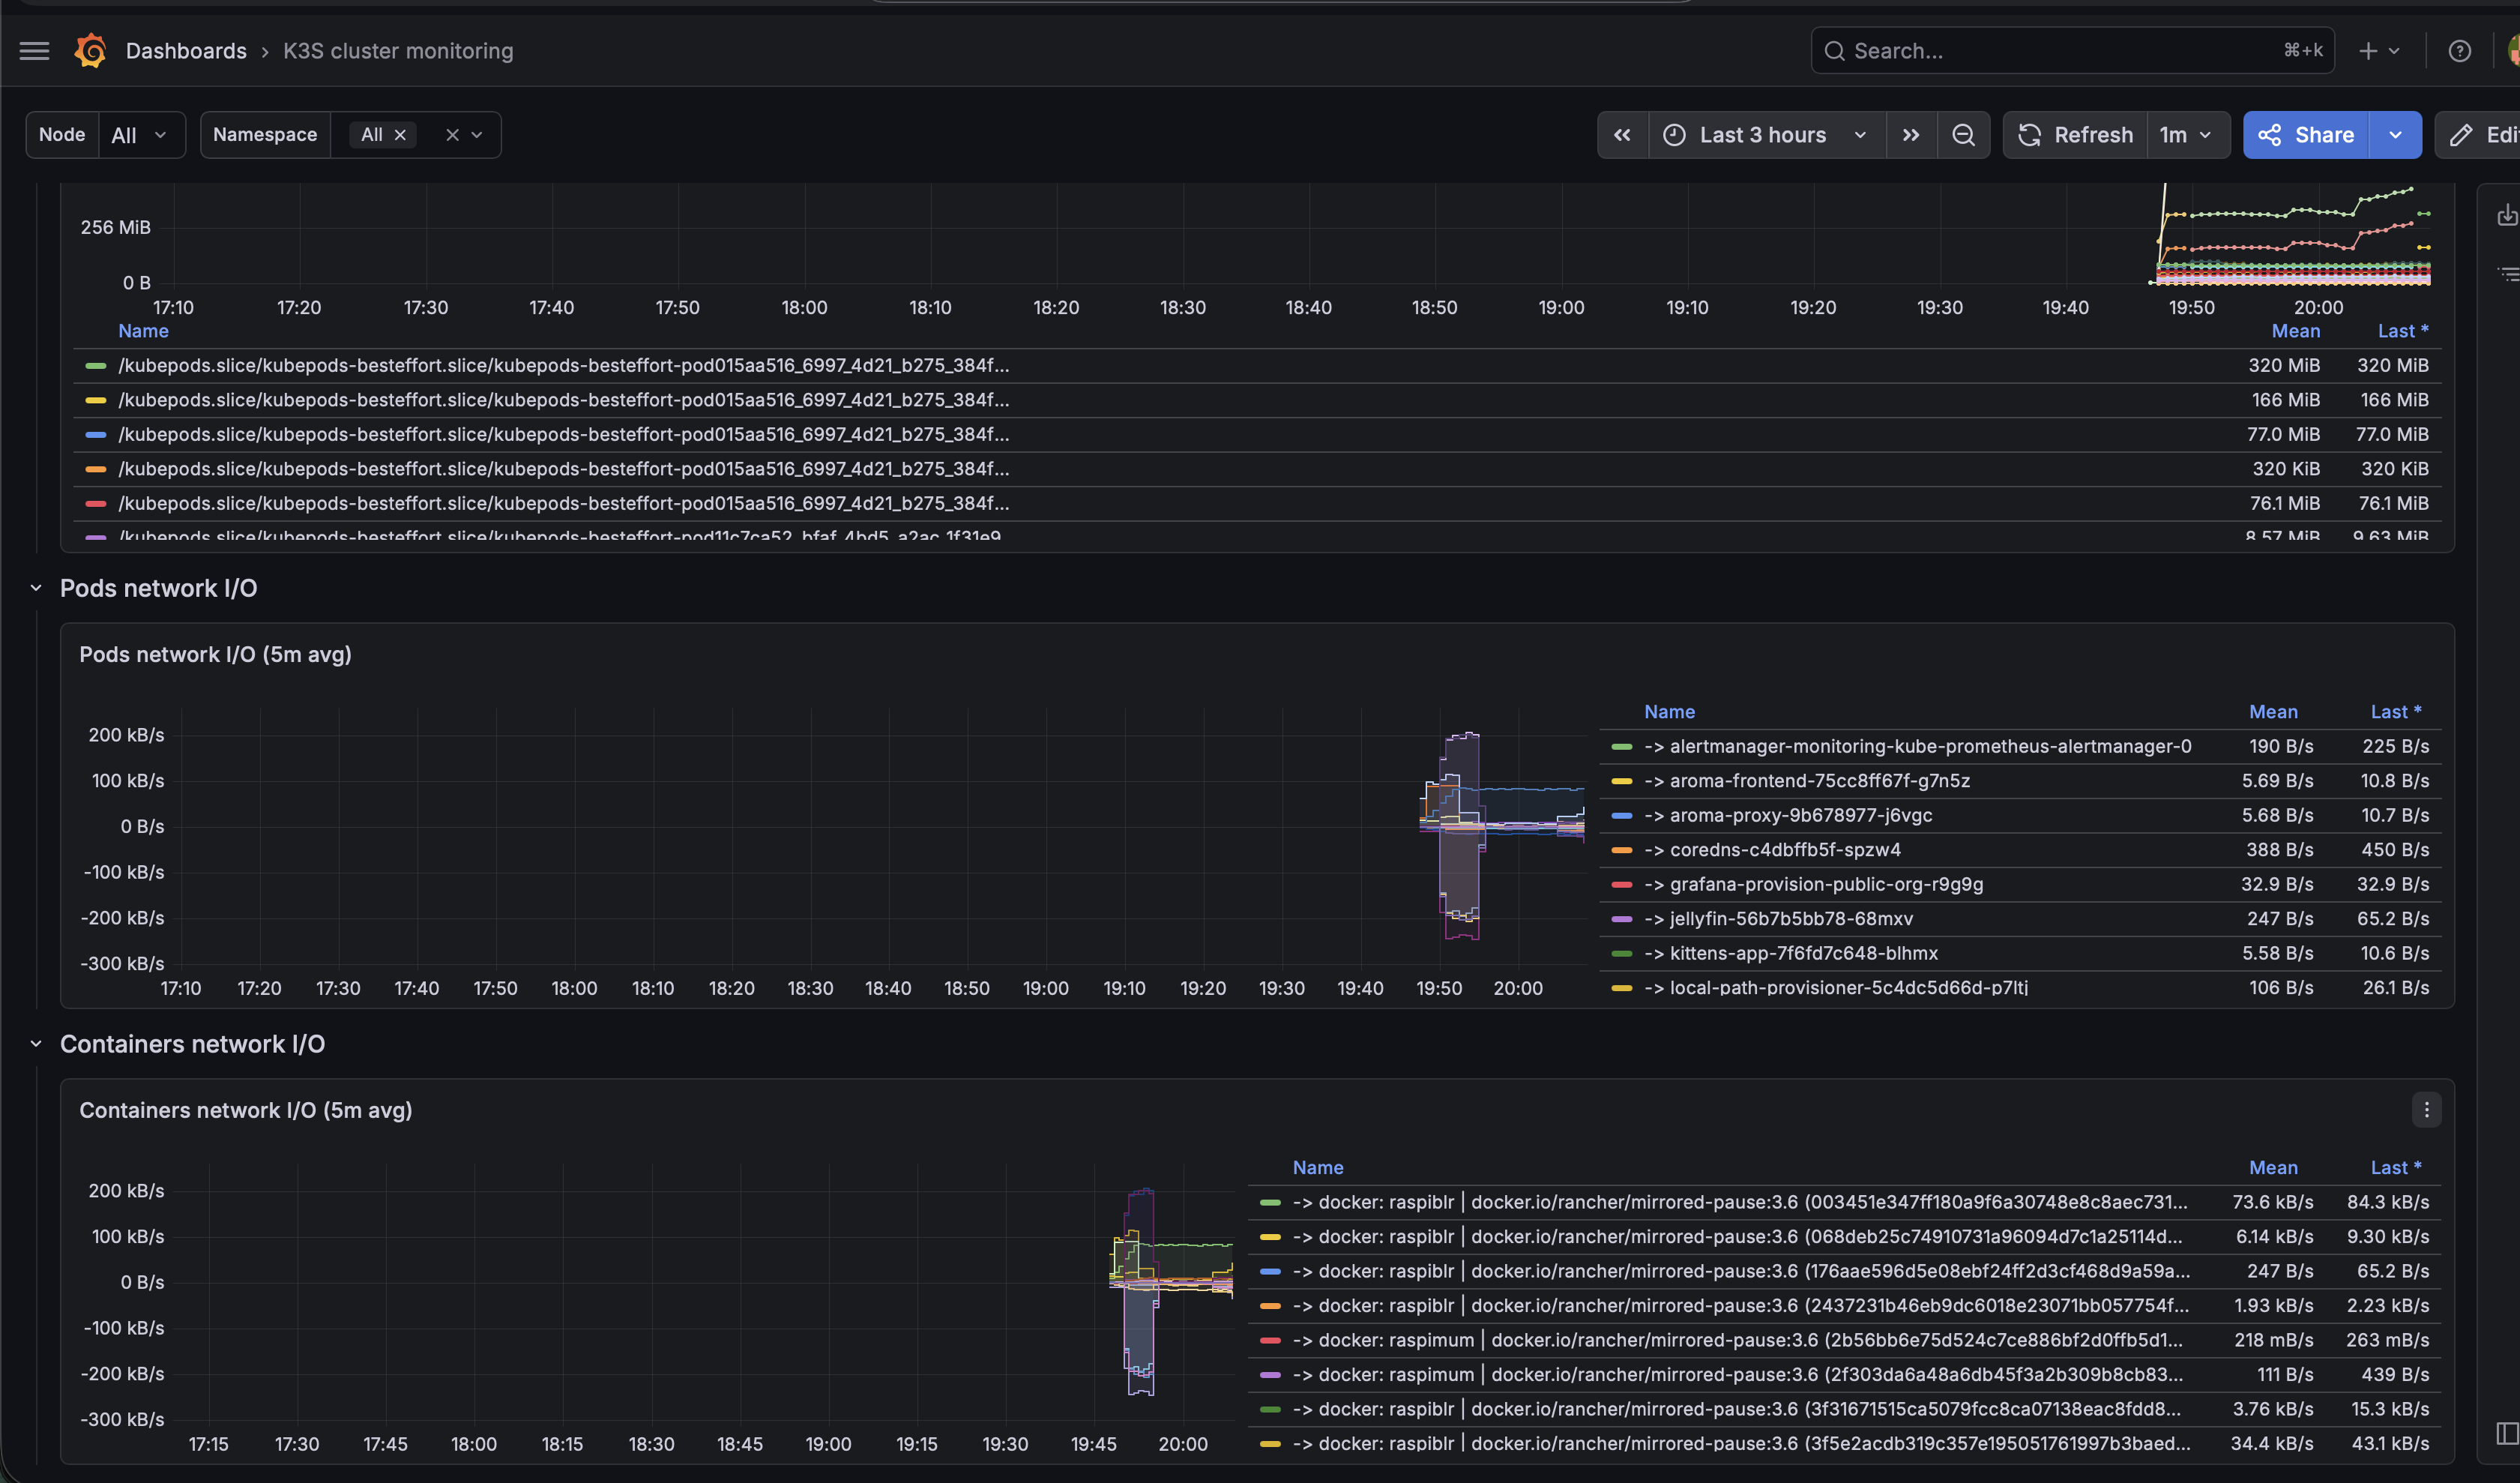
Monitors K3s cluster using Kube-Prometheus. Shows overall cluster CPU / Memory / Filesystem usage as well as individual pod, containers, systemd services statistics. Uses cAdvisor metrics and node metrics.
Origin from dashboard: 15282 (k8s-rke-cluster-monitoring), 8721(K8s RKE cluster monitoring) and will be compatible with k3s
Data source config
Collector config:
Upload an updated version of an exported dashboard.json file from Grafana
| Revision | Description | Created | |
|---|---|---|---|
| Download |

Kubernetes

Monitor your Kubernetes deployment with prebuilt visualizations that allow you to drill down from a high-level cluster overview to pod-specific details in minutes.
Learn more