
Kaiten Internal and Public API
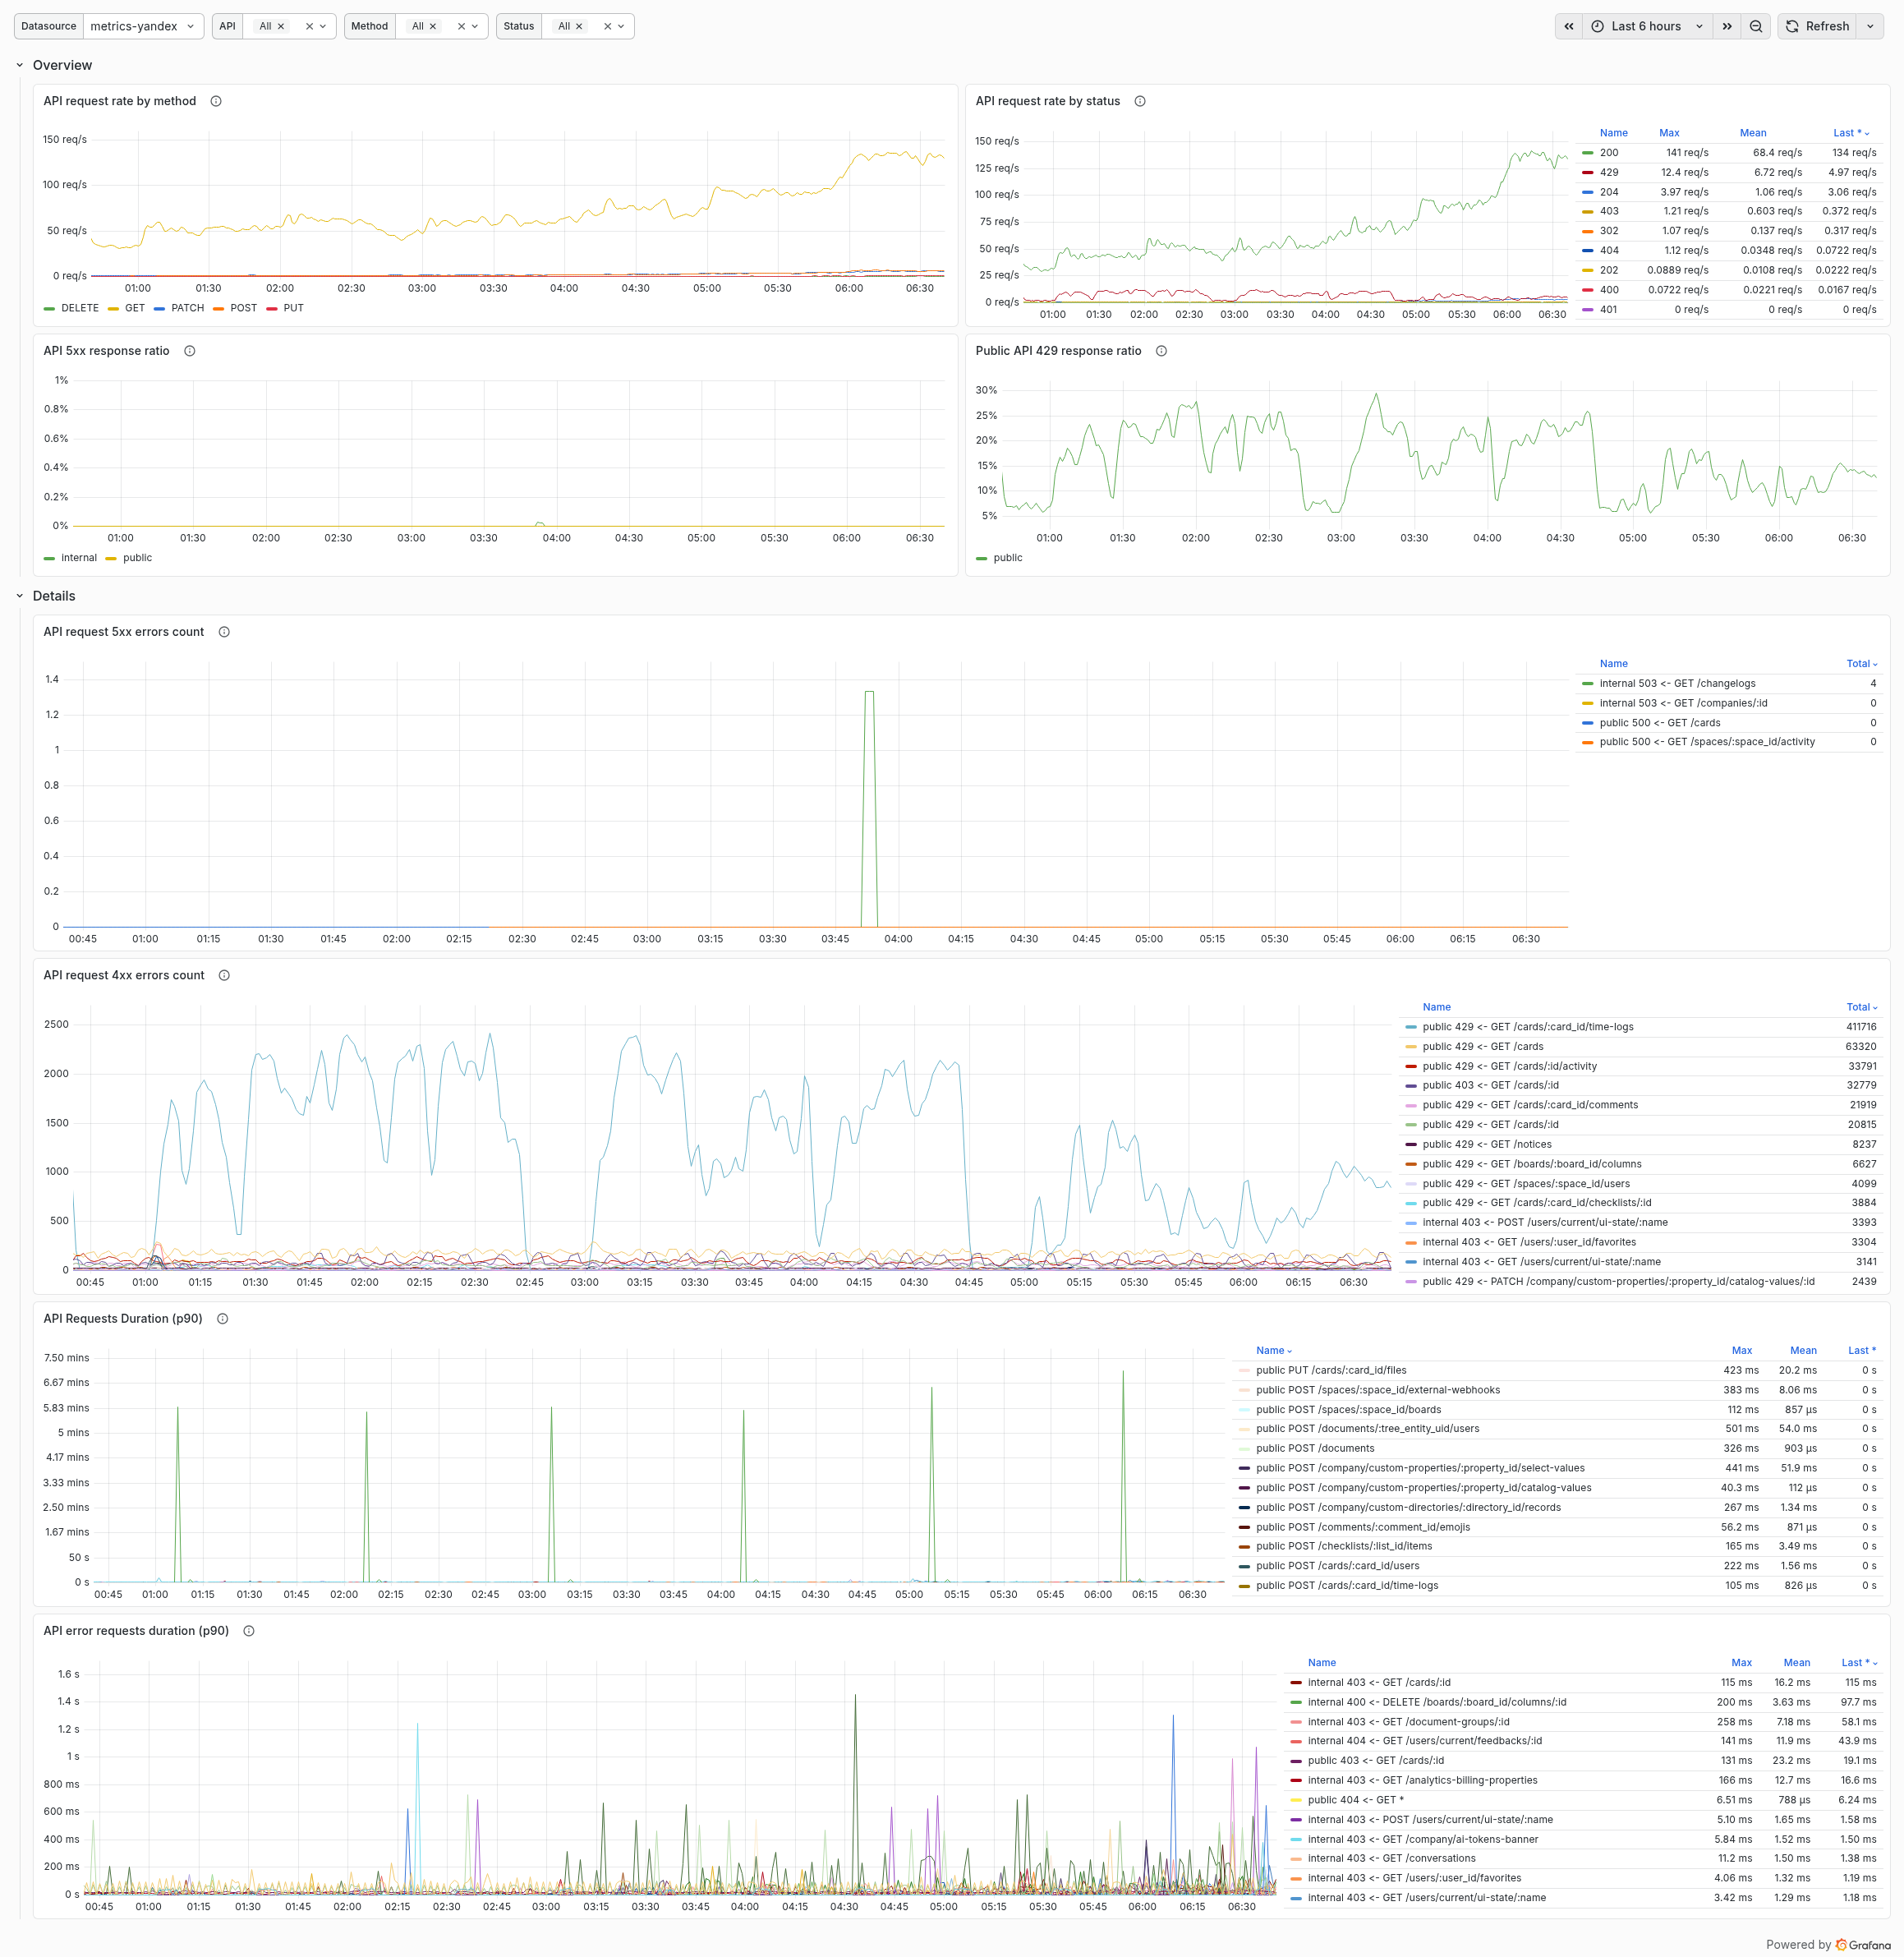
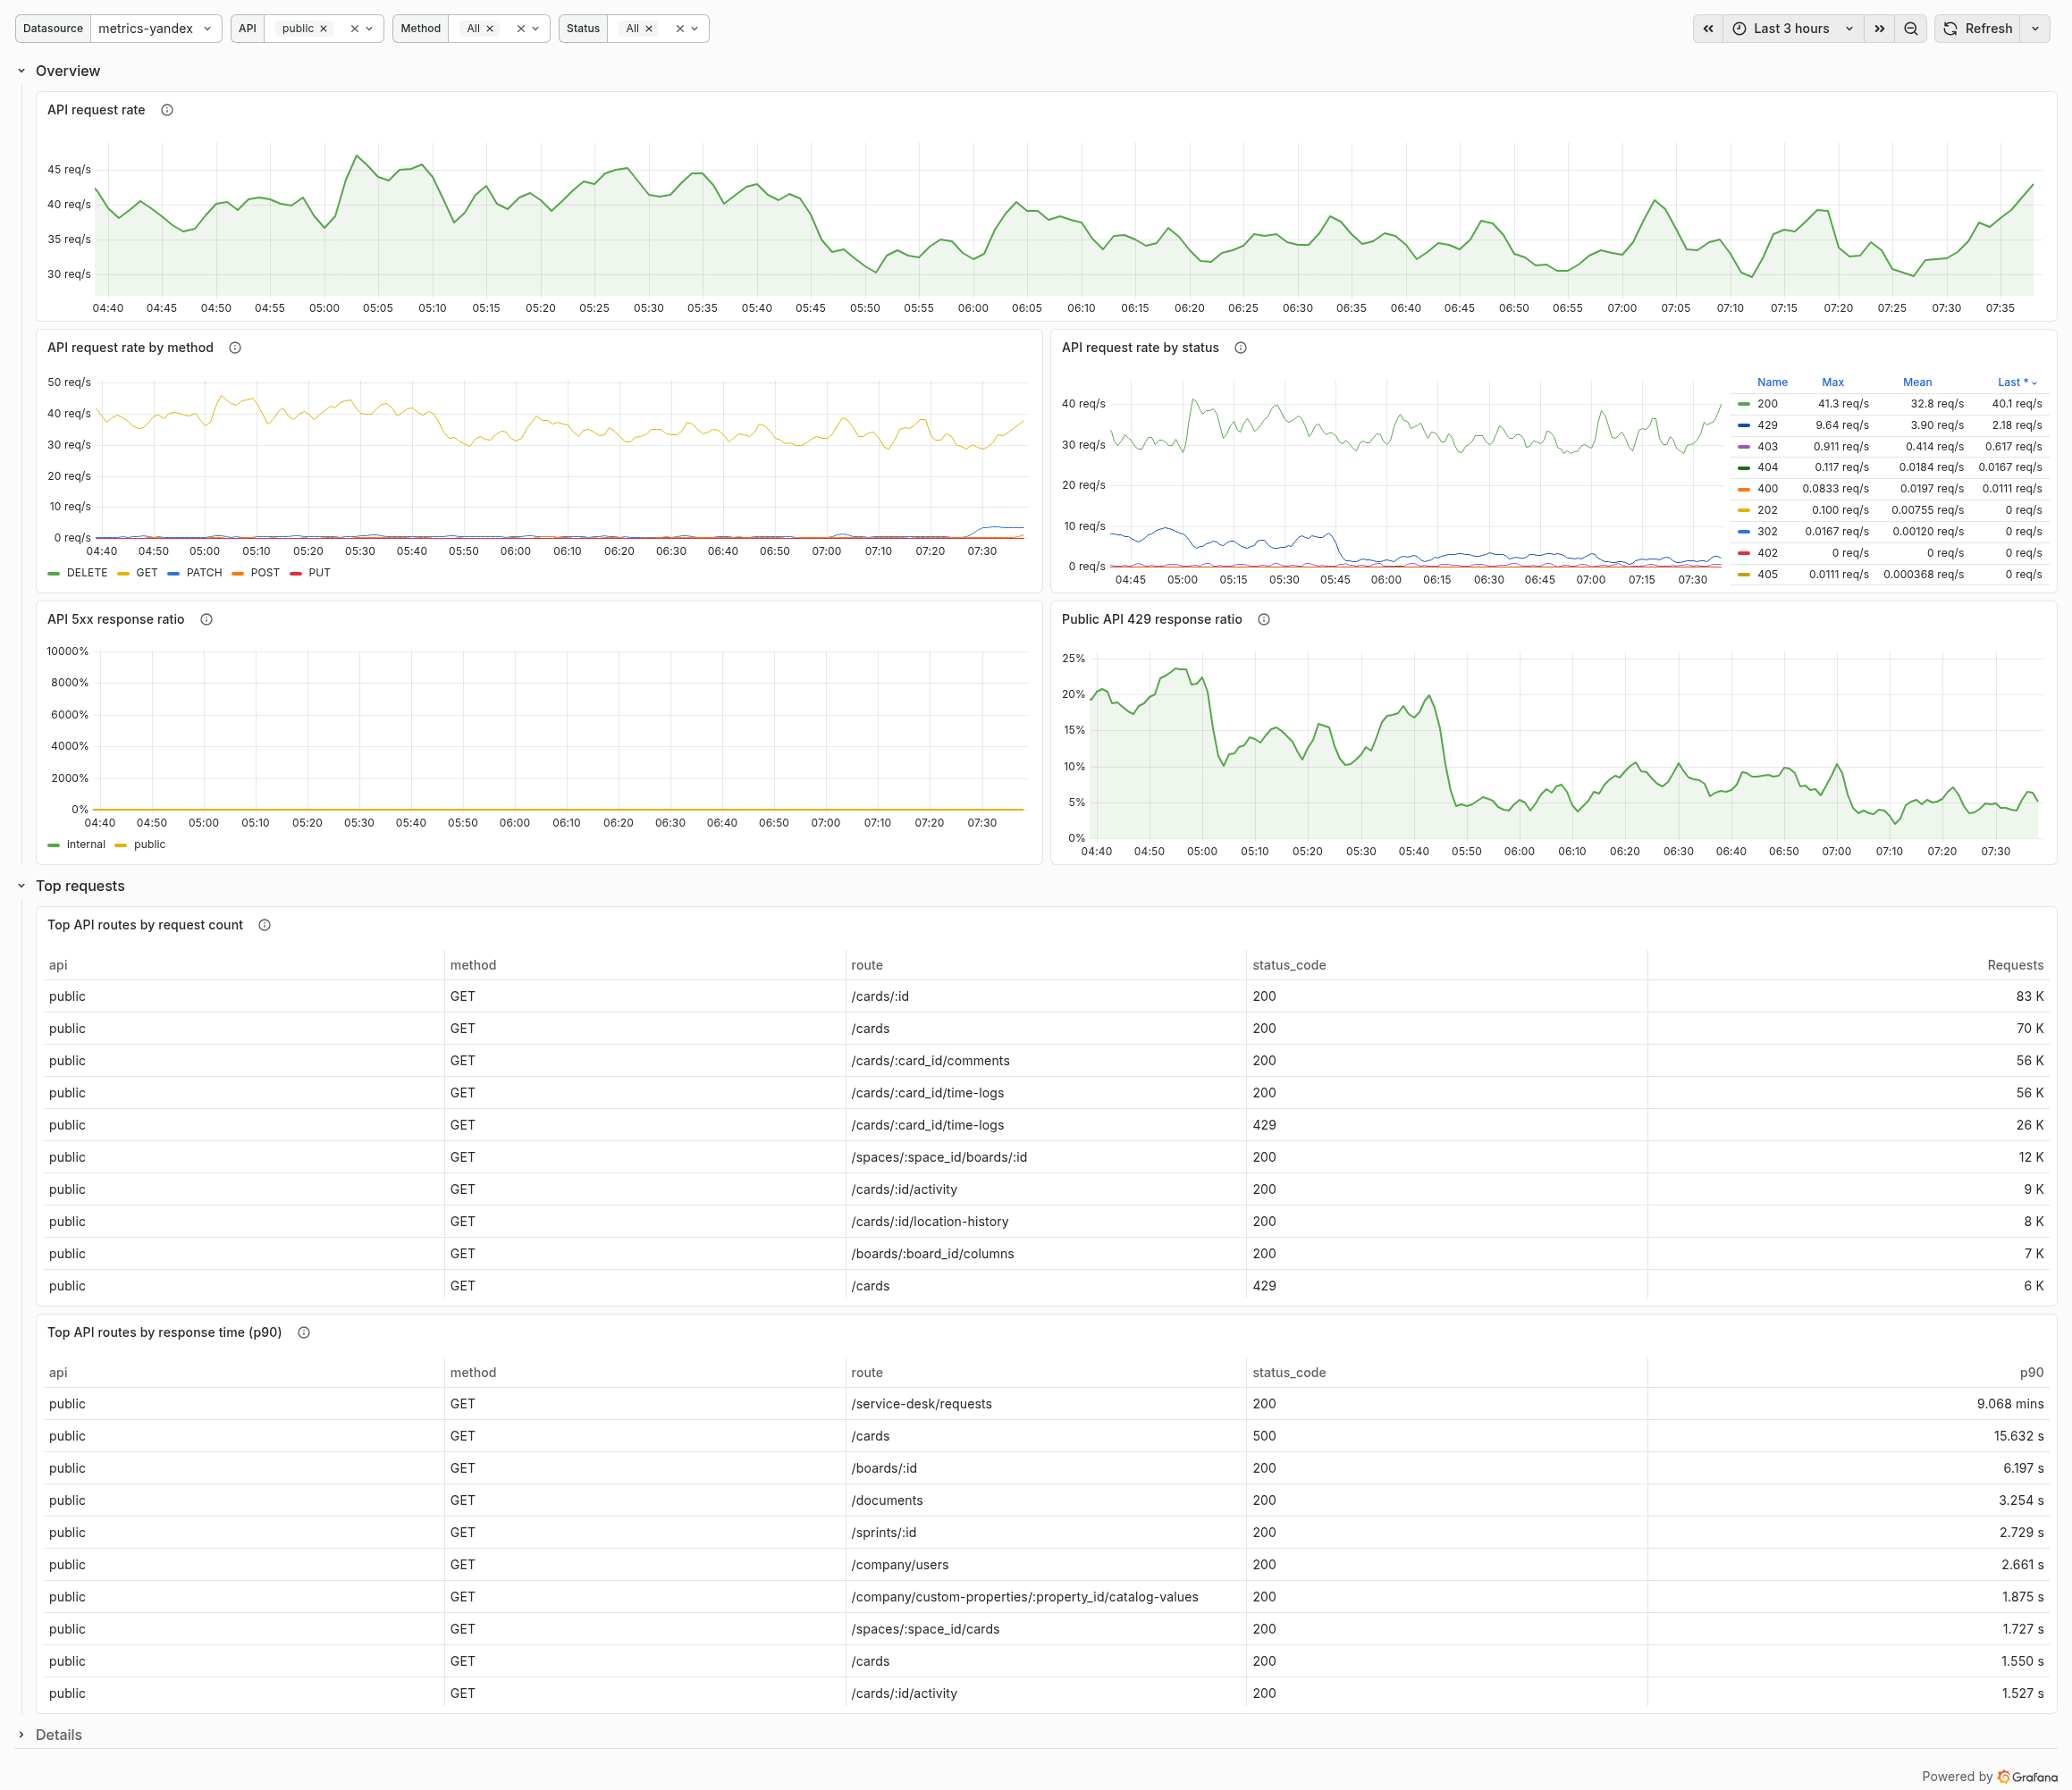
Kaiten API dashboard for on-premises deployments. Shows request rate, response status distribution, 4xx/5xx error counts, 5xx response ratio, public API 429 response ratio, and p90 response time. Use the API filter to switch between internal and public API.
Kaiten Internal and Public API
Dashboard for monitoring Kaiten API health in Enterprise on-premises installations.
It helps compare internal and public API traffic and quickly answer:
- how much API traffic is currently processed
- which methods and response statuses dominate
- how many requests fail with 4xx or 5xx responses
- what share of requests fail with 5xx responses
- how often public API clients hit rate limits
- how long API requests take to complete
Data source config
Collector type:
Collector plugins:
Collector config:
Revisions
Upload an updated version of an exported dashboard.json file from Grafana
| Revision | Description | Created | |
|---|---|---|---|
| Download |