AWS / CloudWatch / RDS / PostgreSQL
RDS PostgreSQL monitoring via native CloudWatch. Select a DB instance from the dropdown — no other configuration needed. Uses absolute-value thresholds (Memory Free, Disk Free) that work universally across instance sizes.
AWS RDS for PostgreSQL Monitoring Dashboard for Grafana - CloudWatch Metrics
A Grafana dashboard for monitoring AWS RDS PostgreSQL instances using native CloudWatch metrics. Covers CPU, memory, storage, disk I/O, network, PostgreSQL internals (transaction ID wraparound, replication slot lag, WAL generation), and Performance Insights DBLoad - all from CloudWatch with no agent required.
Why monitor AWS RDS PostgreSQL?
RDS is the layer where most production outages actually originate: a connection pool exhausts, autovacuum falls behind, a replication slot pins WAL until disk fills, transaction IDs creep toward wraparound, or a noisy query saturates IOPS. Most of these symptoms are visible in CloudWatch hours before they become incidents, but only if someone is watching the right metrics. This dashboard surfaces the early signals on one screen.
It uses absolute-value thresholds (e.g. memory free in bytes, free storage in bytes) instead of percentages, so the same dashboard works on a db.t4g.micro and a db.r6i.16xlarge without re-tuning.
Features
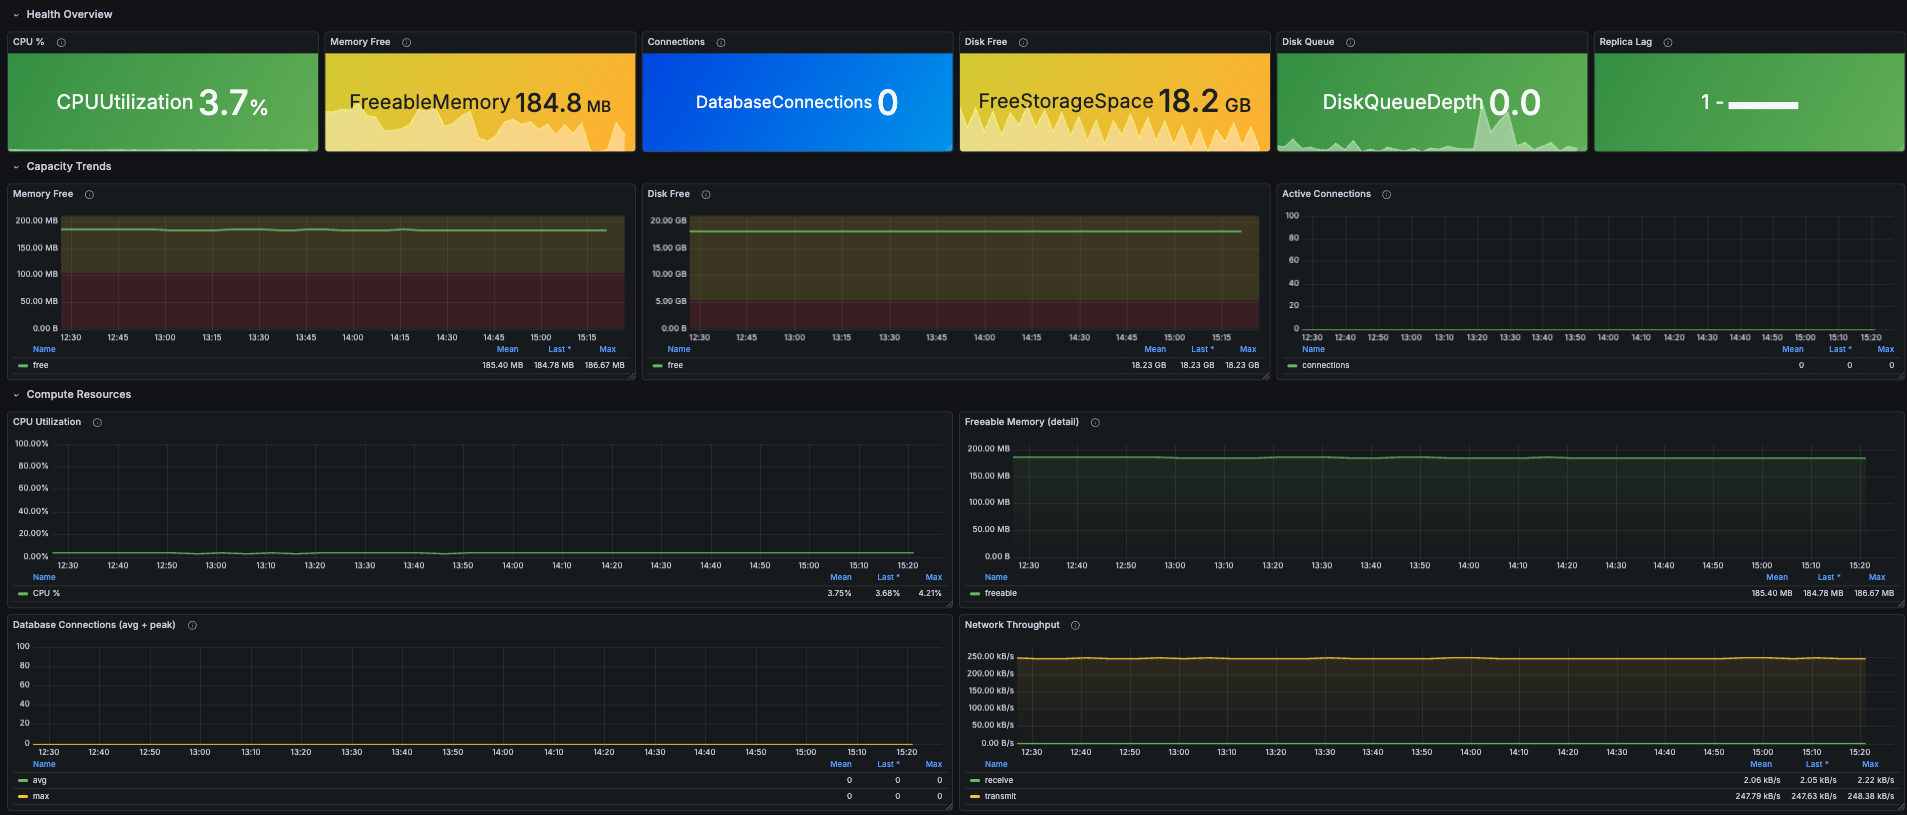
- Health overview - CPU %, freeable memory, free storage, active connections, disk queue depth, replica lag
- Compute trends - CPU utilization, freeable memory detail, connection counts (avg + peak), network throughput in/out
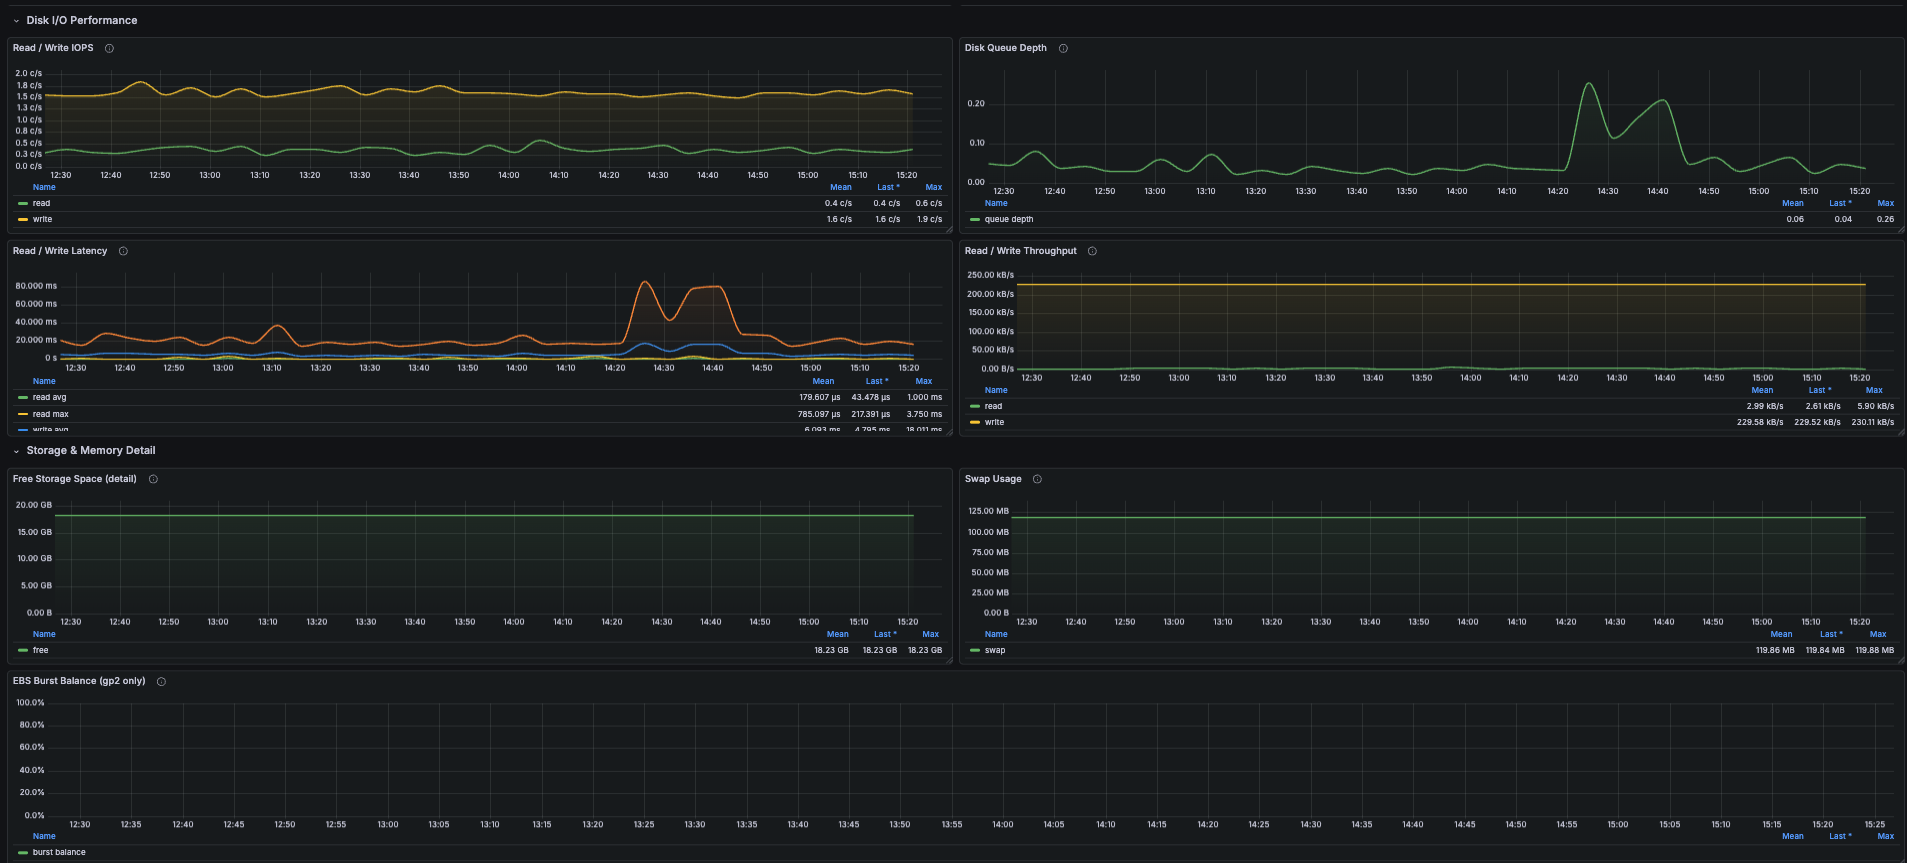
- Disk I/O performance - read/write IOPS, disk queue depth, read/write latency (avg + max), read/write throughput
- Storage detail - free storage trend, swap usage (PostgreSQL should never swap), EBS burst balance for gp2 volumes
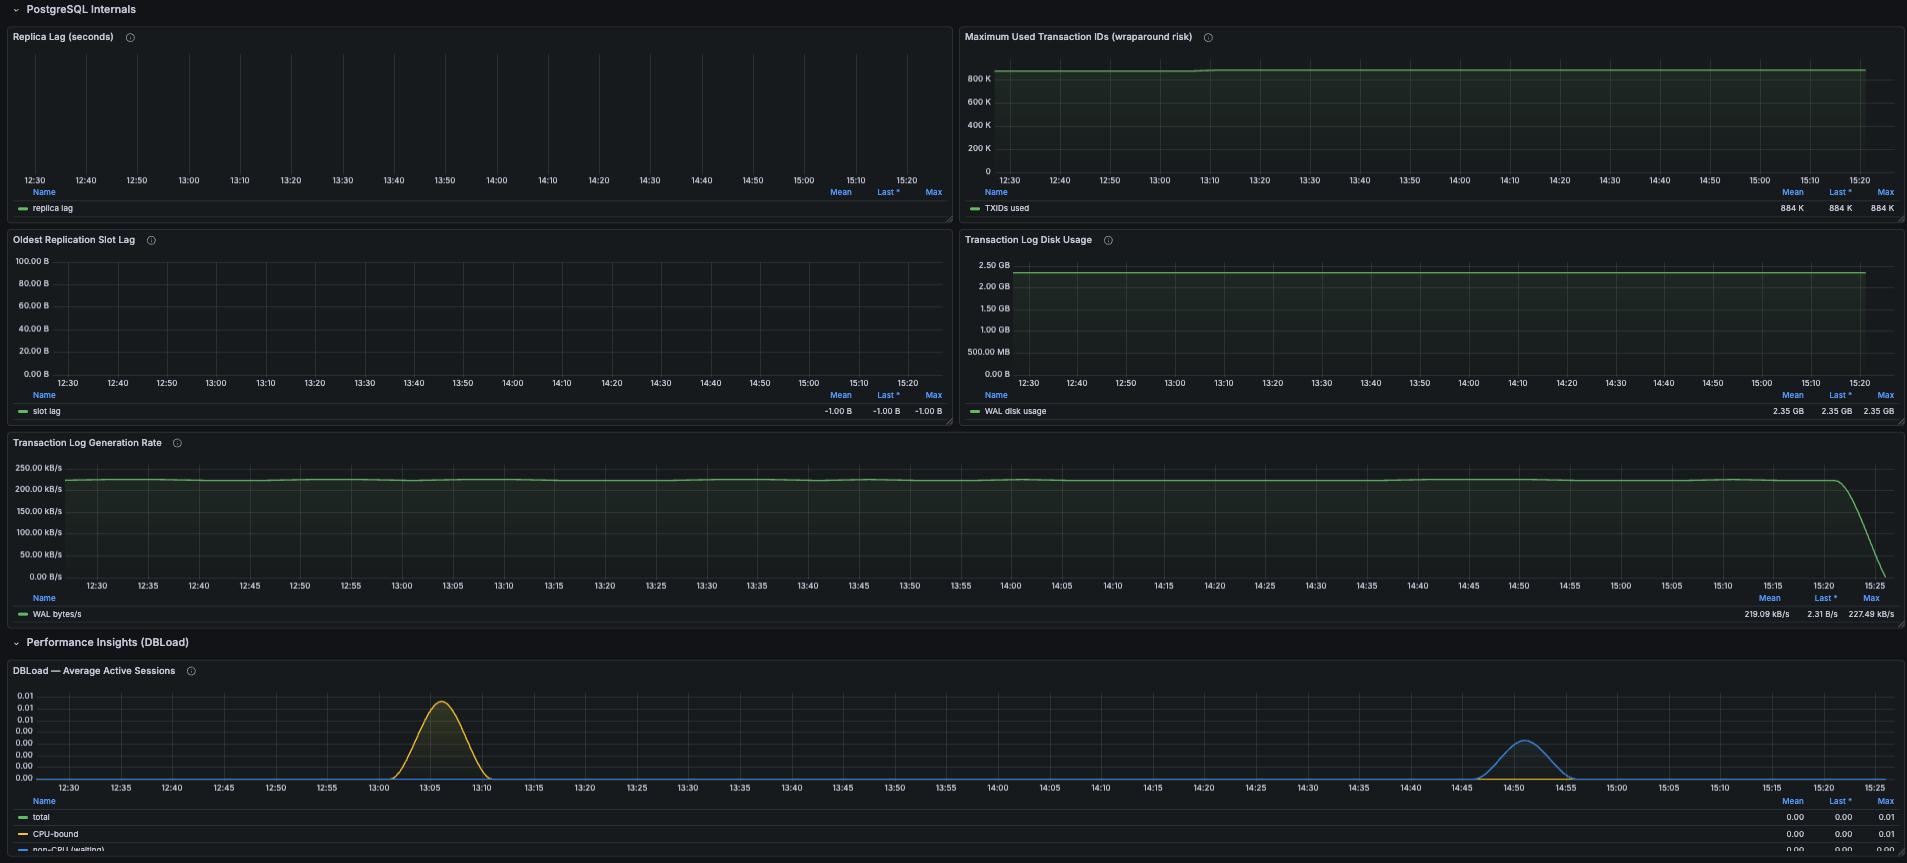
- PostgreSQL internals - replica lag, maximum used transaction IDs (wraparound risk), oldest replication slot lag, WAL disk usage, WAL generation rate
- Performance Insights - DBLoad (Average Active Sessions) split into CPU vs non-CPU (I/O wait, lock wait, etc.) when Performance Insights is enabled
Key CloudWatch Metrics Used
All metrics are from the AWS/RDS namespace, dimensioned by DBInstanceIdentifier.
CPUUtilization
Five-minute average CPU. Sustained values above 80% usually indicate a query plan problem - EXPLAIN your slowest statements via pg_stat_statements or Performance Insights.
FreeableMemory
Bytes available for new allocations. PostgreSQL aggressively caches in shared_buffers, so this stabilizes well below total instance memory under healthy load. Sustained drops mean shared_buffers / work_mem is too aggressive or a connection leak is consuming session memory.
FreeStorageSpace
Bytes free on the data volume. Linear decline = growth (extrapolate to estimate days remaining); sudden drops usually indicate a heavy reindex, vacuum full, or snapshot restore.
DatabaseConnections
Current connection count. Compare against max_connections in your parameter group - note that max_connections is NOT a CloudWatch metric, so threshold alerts need it hardcoded.
DiskQueueDepth, ReadIOPS, WriteIOPS, ReadLatency, WriteLatency
Together these tell you whether EBS is the bottleneck. Queue depth climbing while IOPS plateau is the classic "you've hit provisioned IOPS" signature. Healthy gp3 read/write latency is under 5 ms.
ReplicaLag
Read replica lag in seconds. No data for primary instances - that's expected.
MaximumUsedTransactionIDs
PostgreSQL panics and refuses writes near 2^31 (~2.1 billion). RDS alerts around 1B. Steady growth means autovacuum isn't keeping up - check for long-running transactions and idle replication slots.
OldestReplicationSlotLag
WAL bytes retained by the slowest replication slot. Inactive logical replication slots cause overnight disk-fill incidents.
TransactionLogsDiskUsage, TransactionLogsGeneration
Disk consumed by WAL files and the WAL generation rate. The latter is a clean proxy for write workload intensity.
DBLoad, DBLoadCPU, DBLoadNonCPU
Average Active Sessions from Performance Insights. When DBLoad exceeds your instance's vCPU count, queries are queued. The CPU-vs-non-CPU split tells you whether to scale compute or look at I/O / locking.
Prerequisites
- Grafana 10.0 or later
- AWS CloudWatch datasource plugin configured in Grafana
- IAM permissions on the role/user backing the datasource:
cloudwatch:GetMetricDatacloudwatch:ListMetricscloudwatch:GetMetricStatistics
- Optional: Performance Insights enabled on the RDS instance for the DBLoad panel
Installation
- Download the dashboard JSON.
- In Grafana, go to Dashboards → New → Import.
- Paste the JSON or upload the file.
- When prompted, select your AWS CloudWatch datasource.
- Click Import.
Variables
- Region - AWS region of your RDS instance
- DB Instance - auto-populated from CloudWatch with every
DBInstanceIdentifierthat hasCPUUtilizationdata in the selected region
Troubleshooting
Q: DBLoad panels are empty. A: Performance Insights isn't enabled for the selected instance. Enable it from the RDS console (no instance restart required on most engines).
Q: EBS Burst Balance is empty. A: That's correct for gp3, io1, and io2 volumes - they have no burst concept. The panel only shows data for gp2.
Q: Replica lag is always empty. A: The selected instance is a primary, not a read replica. Pick the replica's identifier to see lag.
Q: Memory % isn't shown - why use absolute bytes?
A: CloudWatch publishes FreeableMemory in bytes but doesn't publish total instance memory. Computing a percentage requires hardcoding instance class memory per instance, which doesn't scale. Absolute thresholds (e.g. <100 MB = critical) work universally.
Related AWS Documentation
- Monitoring Amazon RDS metrics with CloudWatch
- Amazon RDS Performance Insights
- Best practices for RDS PostgreSQL
Tags
aws rds postgresql postgres database cloudwatch monitoring aws-monitoring aws-rds rds-postgresql db-monitoring performance-insights dbload grafana-dashboard
Data source config
Collector config:
Upload an updated version of an exported dashboard.json file from Grafana
| Revision | Description | Created | |
|---|---|---|---|
| Download |
AWS
Easily visualize and alert on more than 60 Amazon Web Services (AWS) resources using the fully managed Grafana Cloud platform.
Learn more