GreenKube: Kubernetes FinGreenOps – Cost & CO2 Footprint
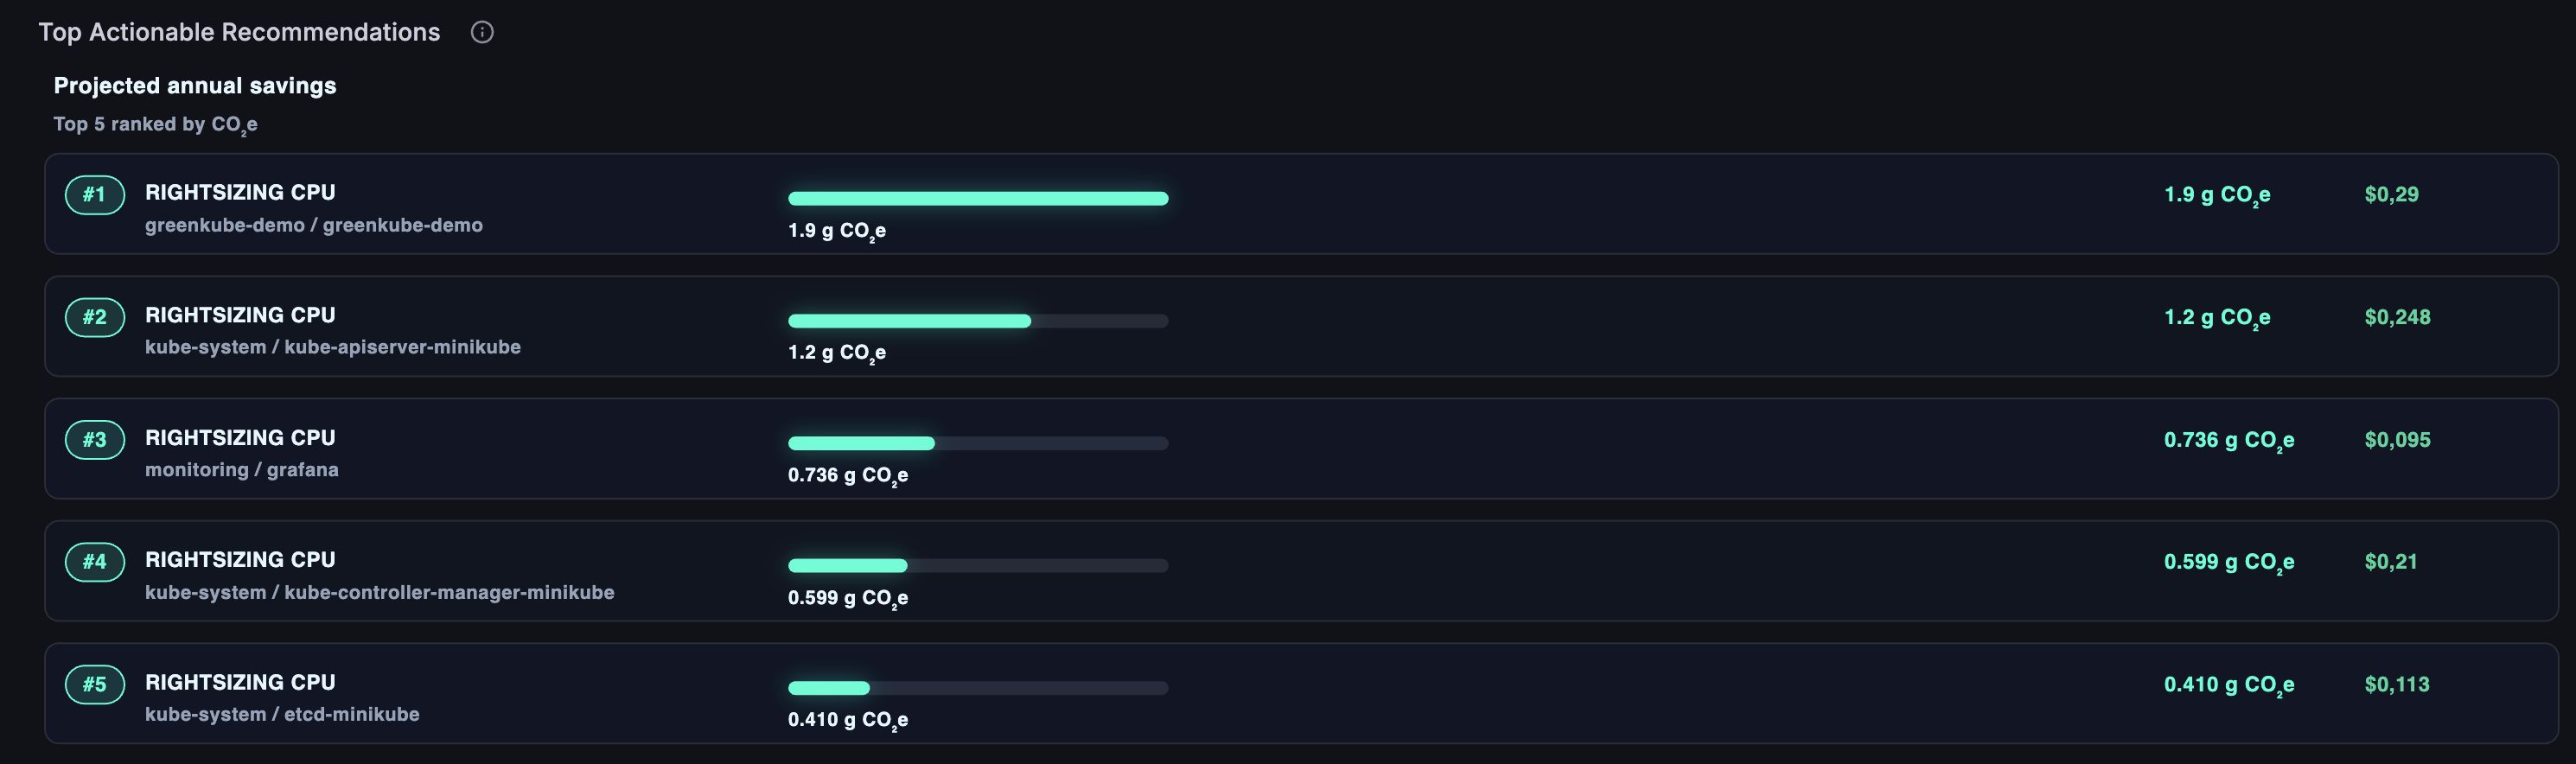
FinGreenOps dashboard for Kubernetes — sustainability score, CO₂ emissions (Scope 2 & 3), cloud costs, regional node cleanliness, top namespace impact, pod spend, and realized savings.
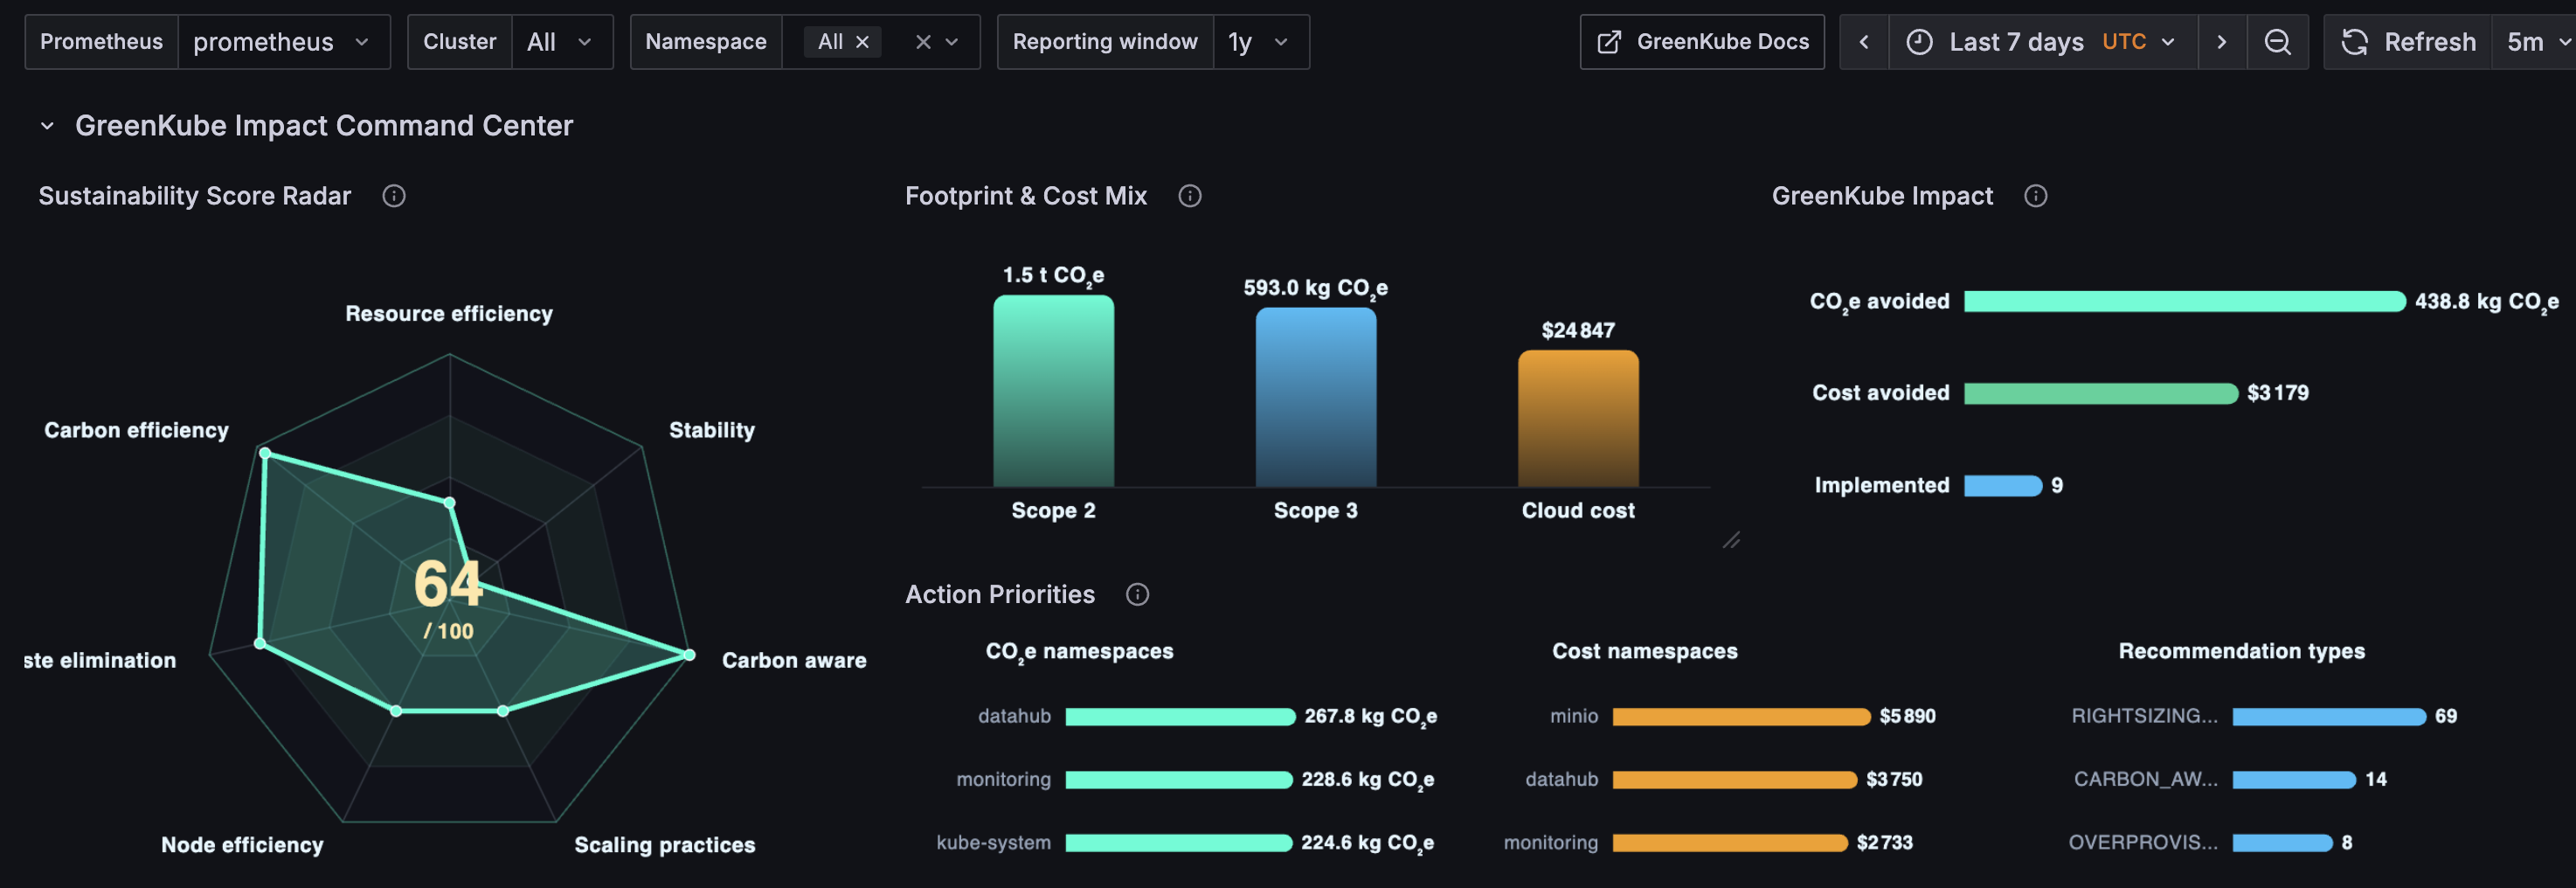
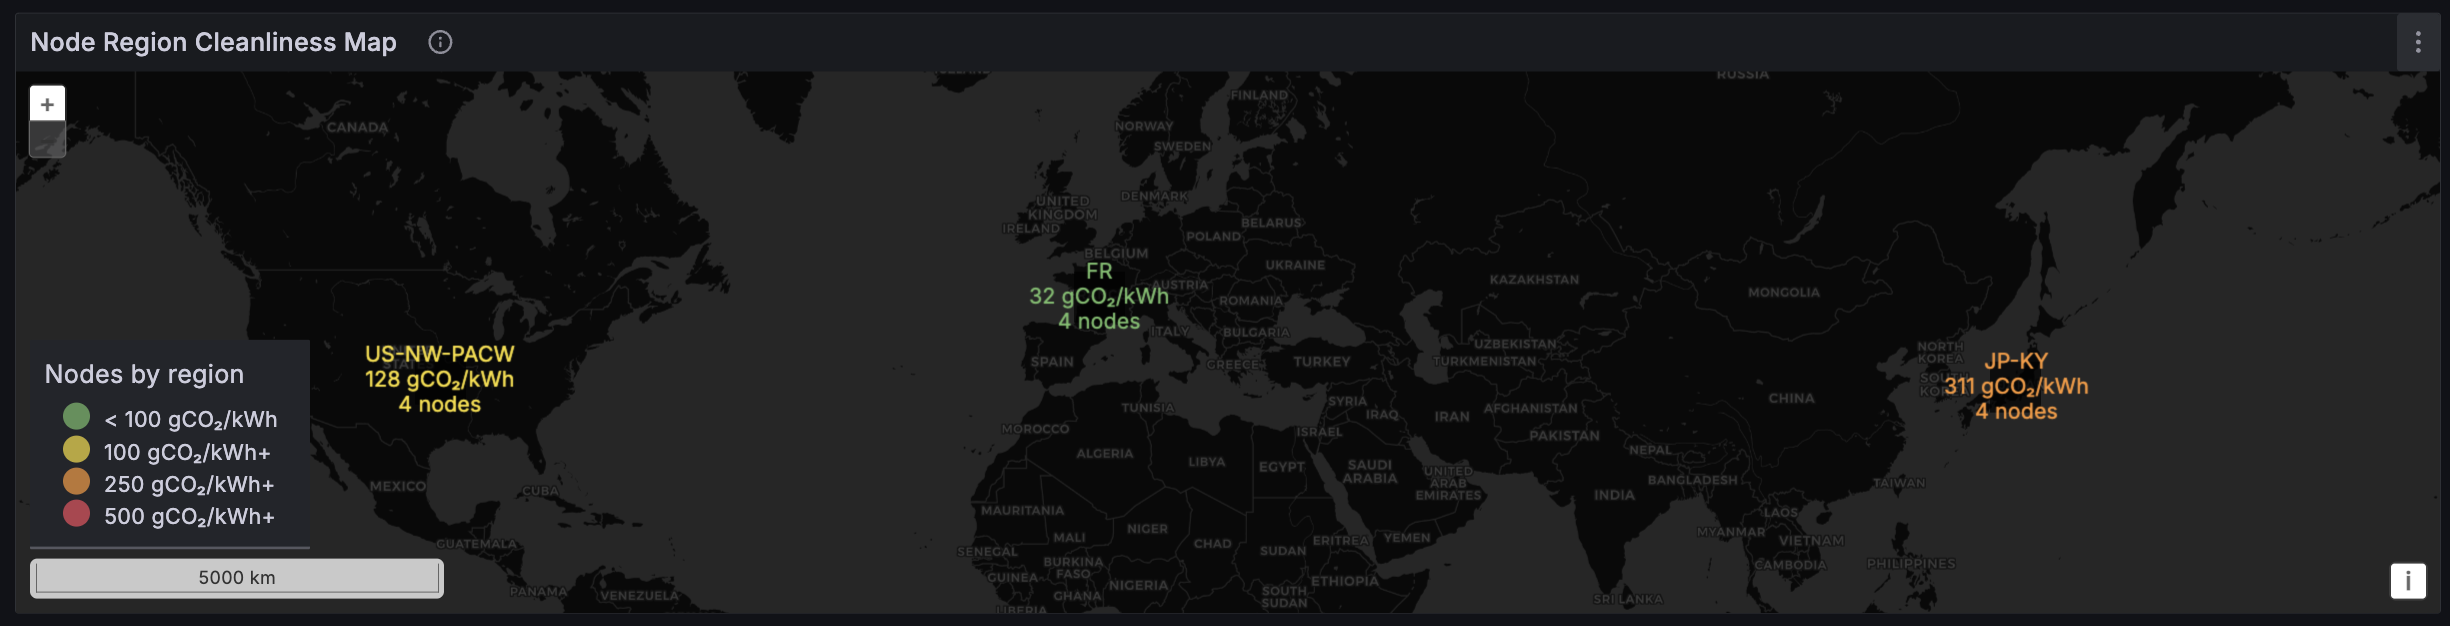
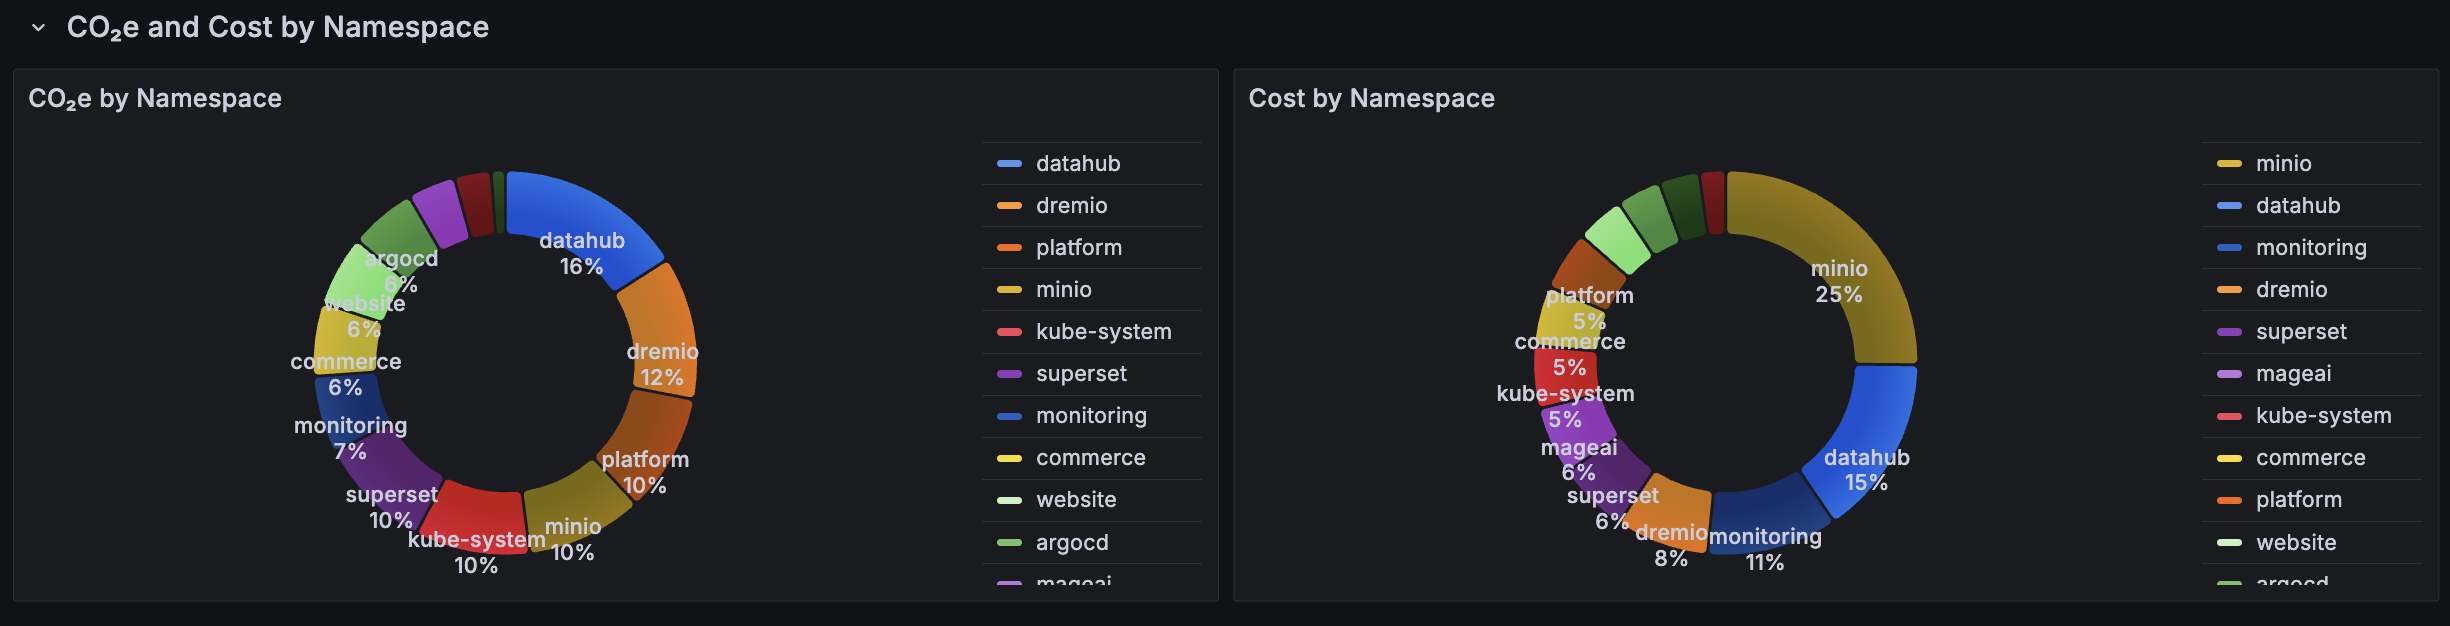
The GreenKube: Kubernetes FinGreenOps – Cost & CO2 Footprint dashboard uses the prometheus data source to create a Grafana dashboard with the bargauge, geomap, piechart and volkovlabs-echarts-panel panels.
Data source config
Collector type:
Collector plugins:
Collector config:
Revisions
Upload an updated version of an exported dashboard.json file from Grafana
| Revision | Description | Created | |
|---|---|---|---|
| Download |
Kubernetes
Monitor your Kubernetes deployment with prebuilt visualizations that allow you to drill down from a high-level cluster overview to pod-specific details in minutes.
Learn more