OpenCode
Monitoring dashboard for OpenCode CLI usage. Tracks sessions, user prompts, LLM call volume, token consumption (including cache read/write ratios), tool executions and failure rates, latency percentiles, model breakdowns, and exceptions. Data sourced from Application Insights via OpenTelemetry.
OpenCode Monitoring Dashboard
Monitor OpenCode CLI usage and performance using Application Insights and OpenTelemetry data.
What This Dashboard Shows
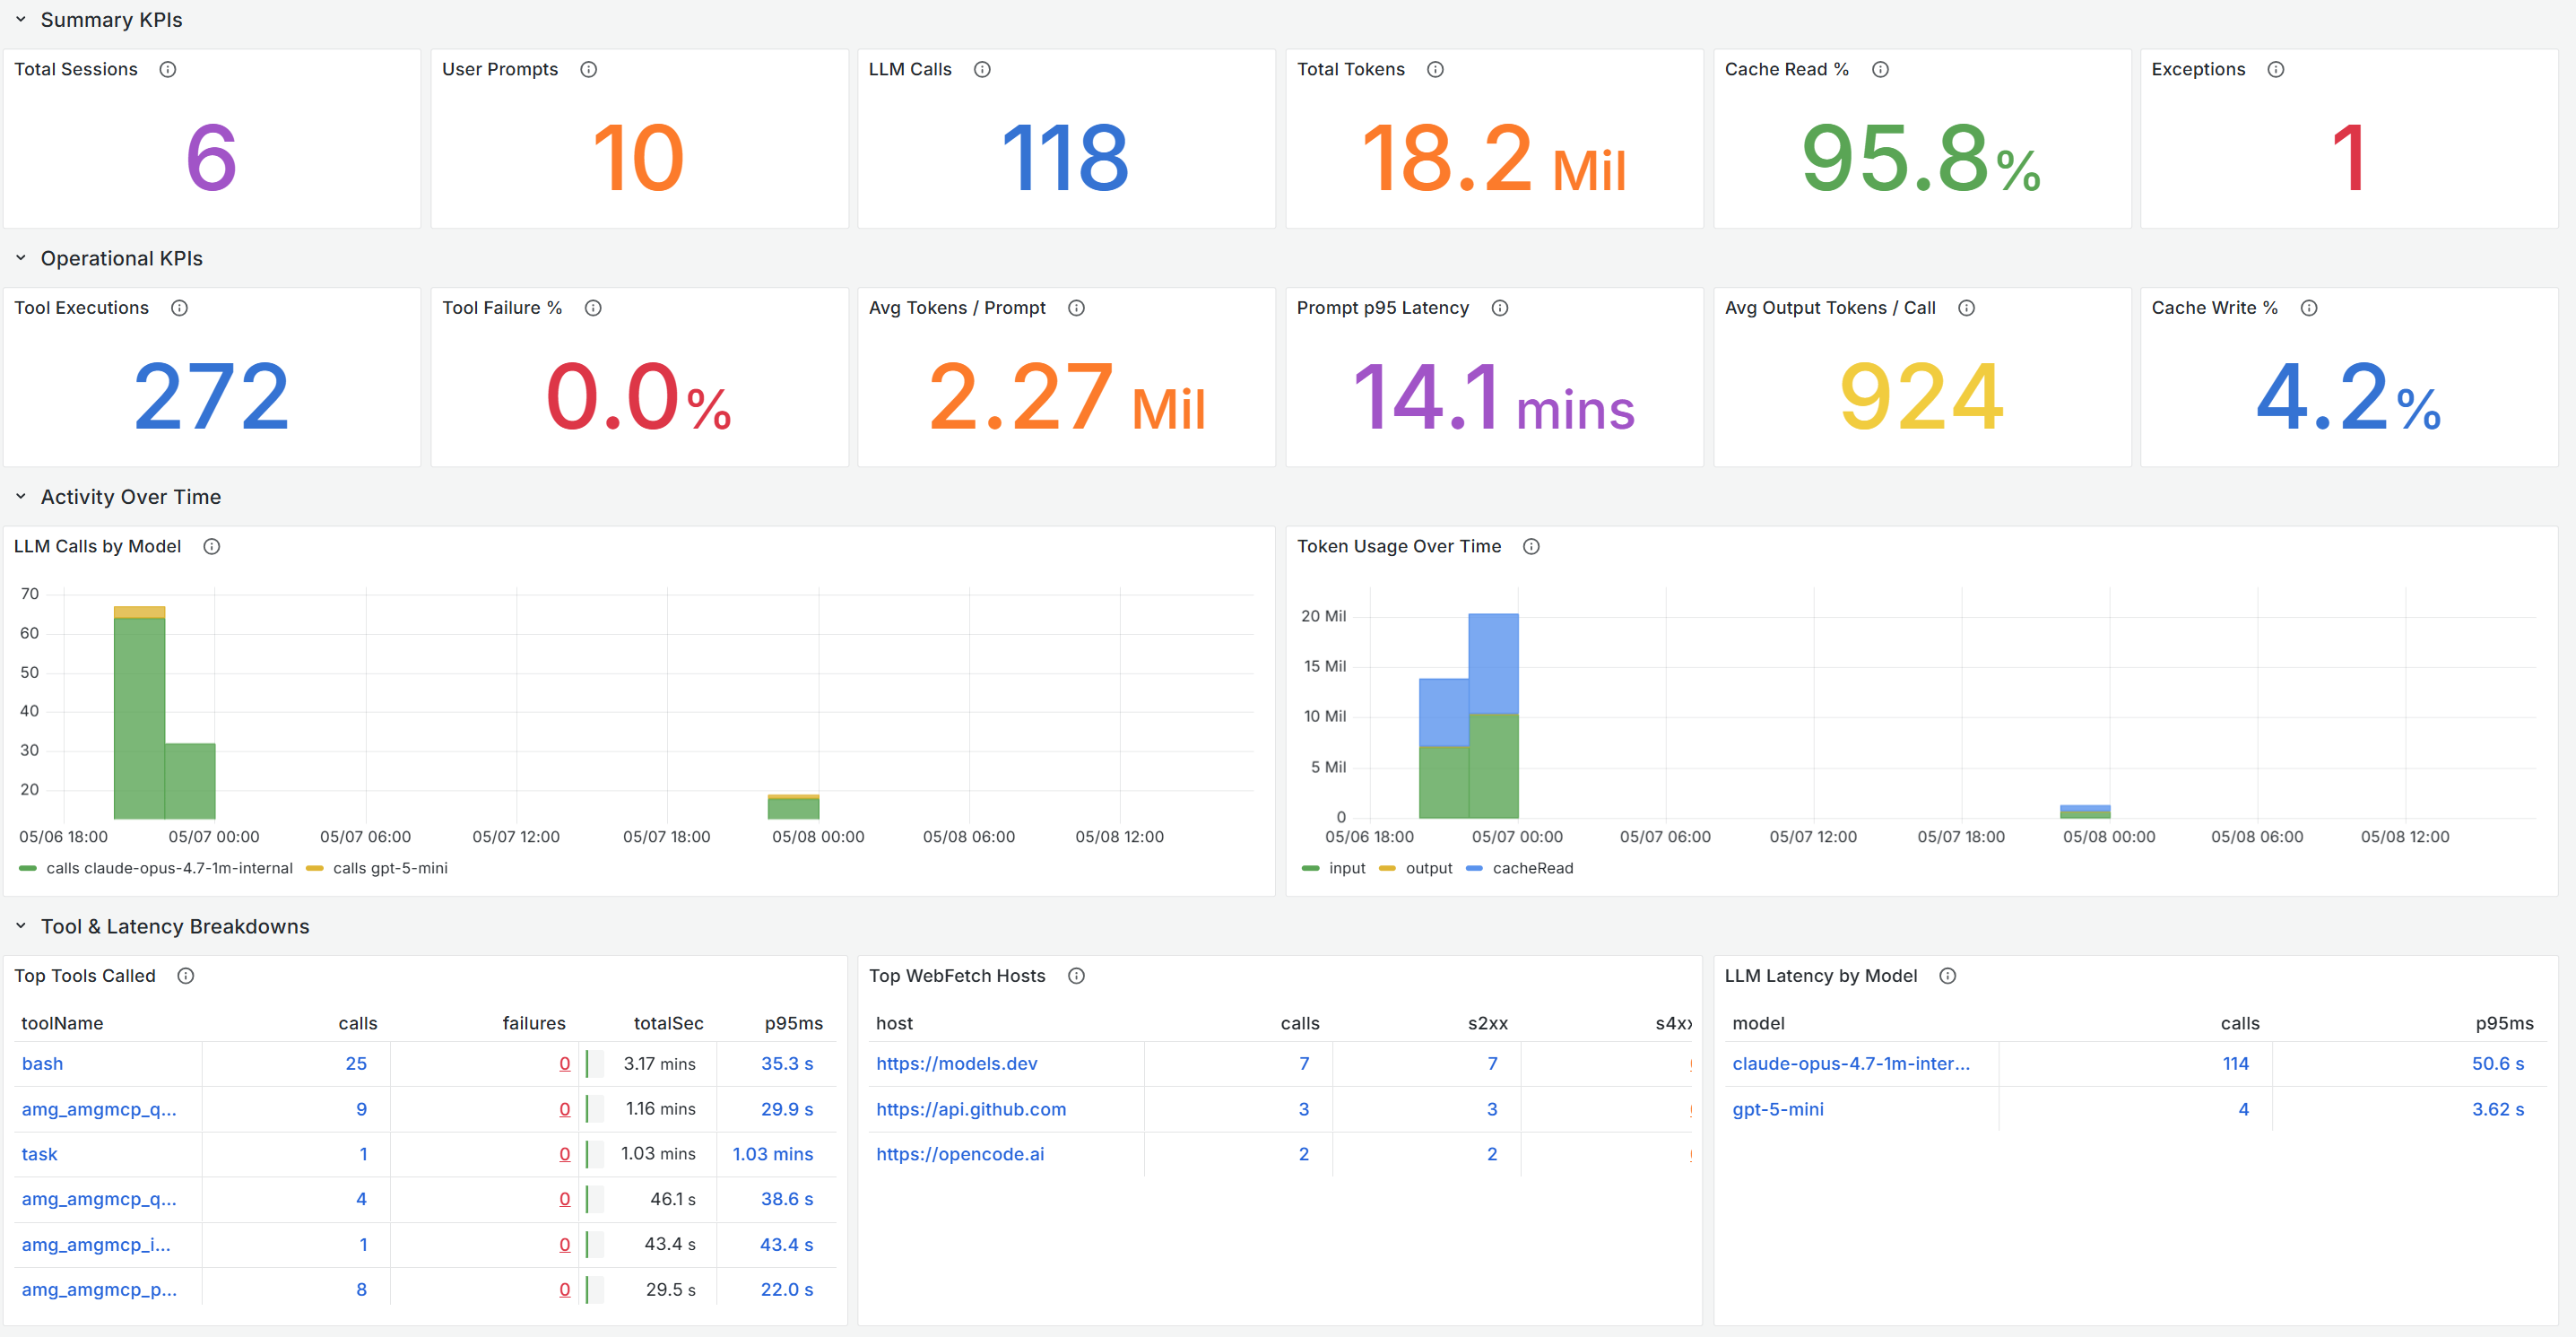
- Summary KPIs: Total sessions, user prompts, LLM calls, total tokens, cache read %, and exceptions
- Operational KPIs: Tool executions, failure rates, avg tokens per prompt, P95 latency
- Activity Over Time: LLM calls by model, token usage trends
- Tool & Latency Breakdowns: Top tools called, WebFetch hosts, LLM latency by model
- Sessions & Errors: Top sessions by token usage, exception tracking, provider split
- Cache Analytics: LLM finish reasons, prompt latency, cache hit ratio over time
Prerequisites
- Azure Managed Grafana instance
- Application Insights resource with OpenTelemetry data from OpenCode
- Azure Monitor data source configured in Grafana
Getting Started
- Import this dashboard into your Azure Managed Grafana instance
- Select your Azure Monitor data source
- Configure the Application Insights resource filter
For detailed setup instructions, visit: https://aka.ms/amg/dash-doc/opencode
Data source config
Collector type:
Collector plugins:
Collector config:
Revisions
Upload an updated version of an exported dashboard.json file from Grafana
| Revision | Description | Created | |
|---|---|---|---|
| Download |