OpenClaw
Monitoring dashboard for OpenClaw gateway usage. Tracks message processing, LLM token consumption, channel activity, stuck sessions, and errors across WhatsApp and WeChat channels.
OpenClaw Monitoring Dashboard
Monitor OpenClaw gateway usage across WhatsApp and WeChat channels using Application Insights and OpenTelemetry data.
What This Dashboard Shows
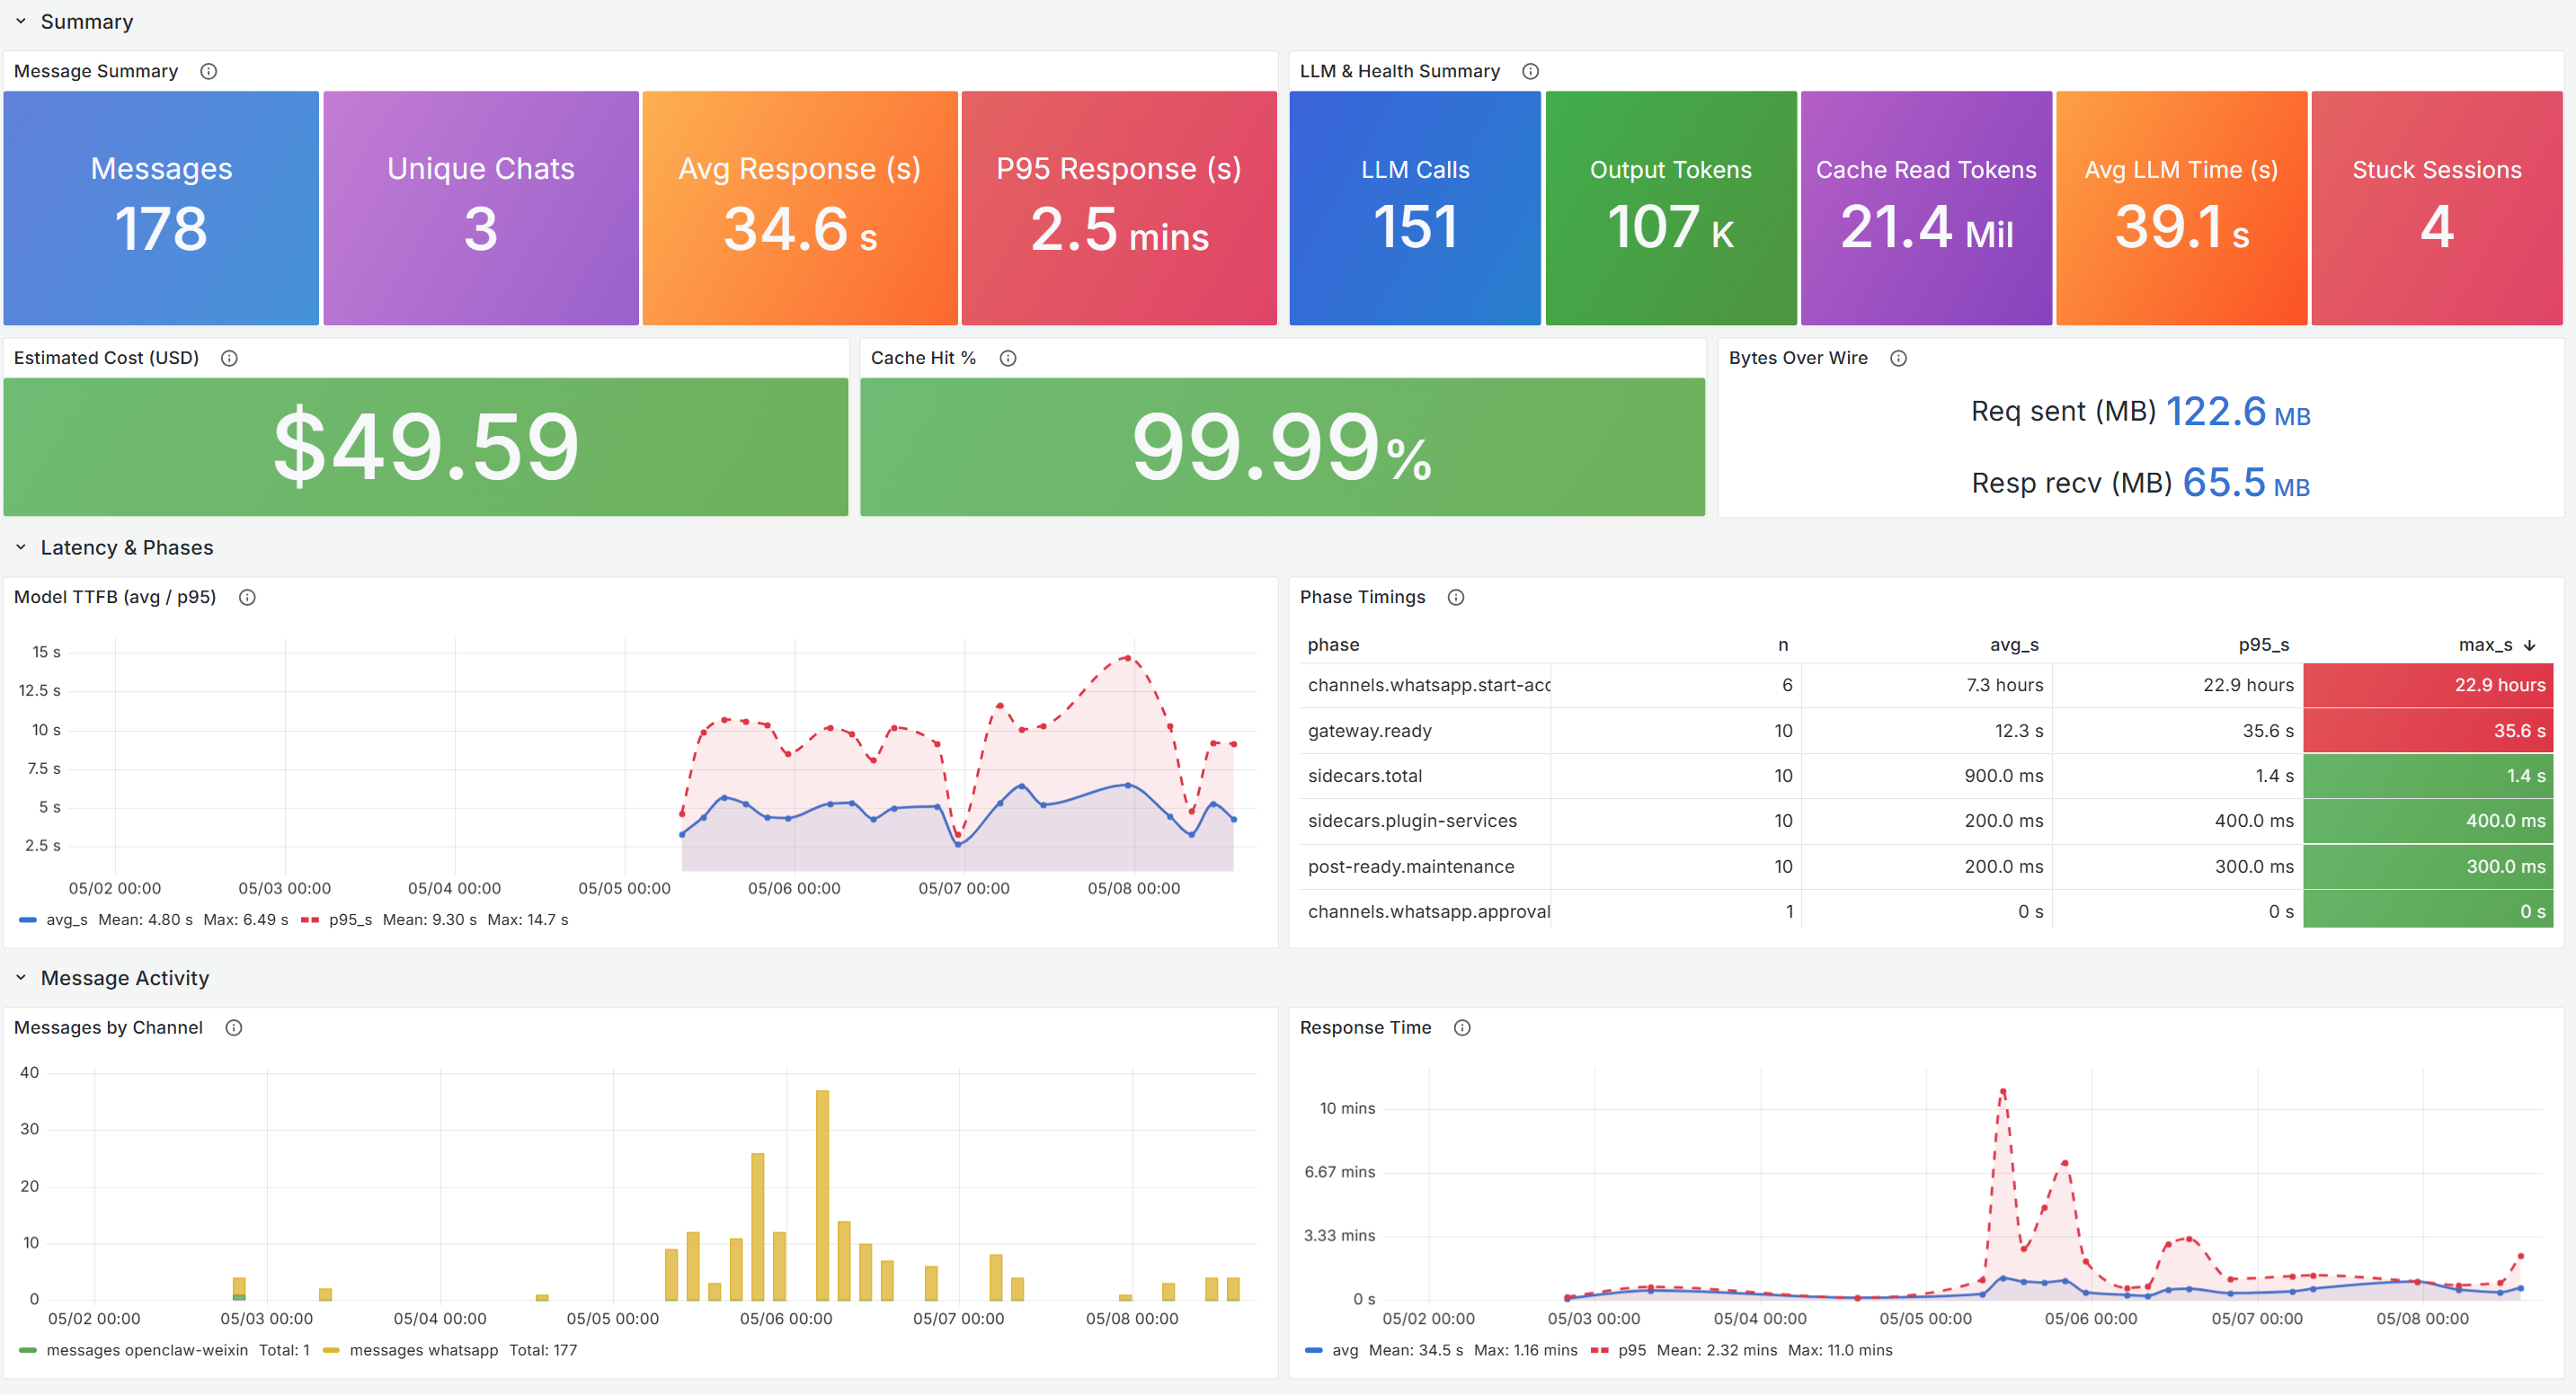
- Message Processing: Total messages handled, unique chat sessions, average and P95 response times
- LLM Token Consumption: Input/output token usage and cost tracking
- Channel Activity: Message volume breakdown by WhatsApp and WeChat channels
- Stuck Sessions: Detection and tracking of sessions that stop responding
- Error Monitoring: Exception rates and error breakdowns
Prerequisites
- Azure Managed Grafana instance
- Application Insights resource with OpenTelemetry data from OpenClaw
- Azure Monitor data source configured in Grafana
Getting Started
- Import this dashboard into your Azure Managed Grafana instance
- Select your Azure Monitor data source
- Configure the Application Insights resource filter
For detailed setup instructions, visit: https://aka.ms/amg/dash-doc/openclaw
Data source config
Collector type:
Collector plugins:
Collector config:
Revisions
Upload an updated version of an exported dashboard.json file from Grafana
| Revision | Description | Created | |
|---|---|---|---|
| Download |