Vault / Overview
A dashboard that monitors Vault. It is created using the [vault-mixin](https://github.com/adinhodovic/vault-mixin). For an in-depth view of Go runtime internals (CPU, memory, GC, scheduling, contention, file descriptor pressure), pair this dashboard with the [Go / Overview dashboard](https://grafana.com/grafana/dashboards/25063-go-overview/) from the [go-mixin](https://github.com/adinhodovic/go-mixin) project.
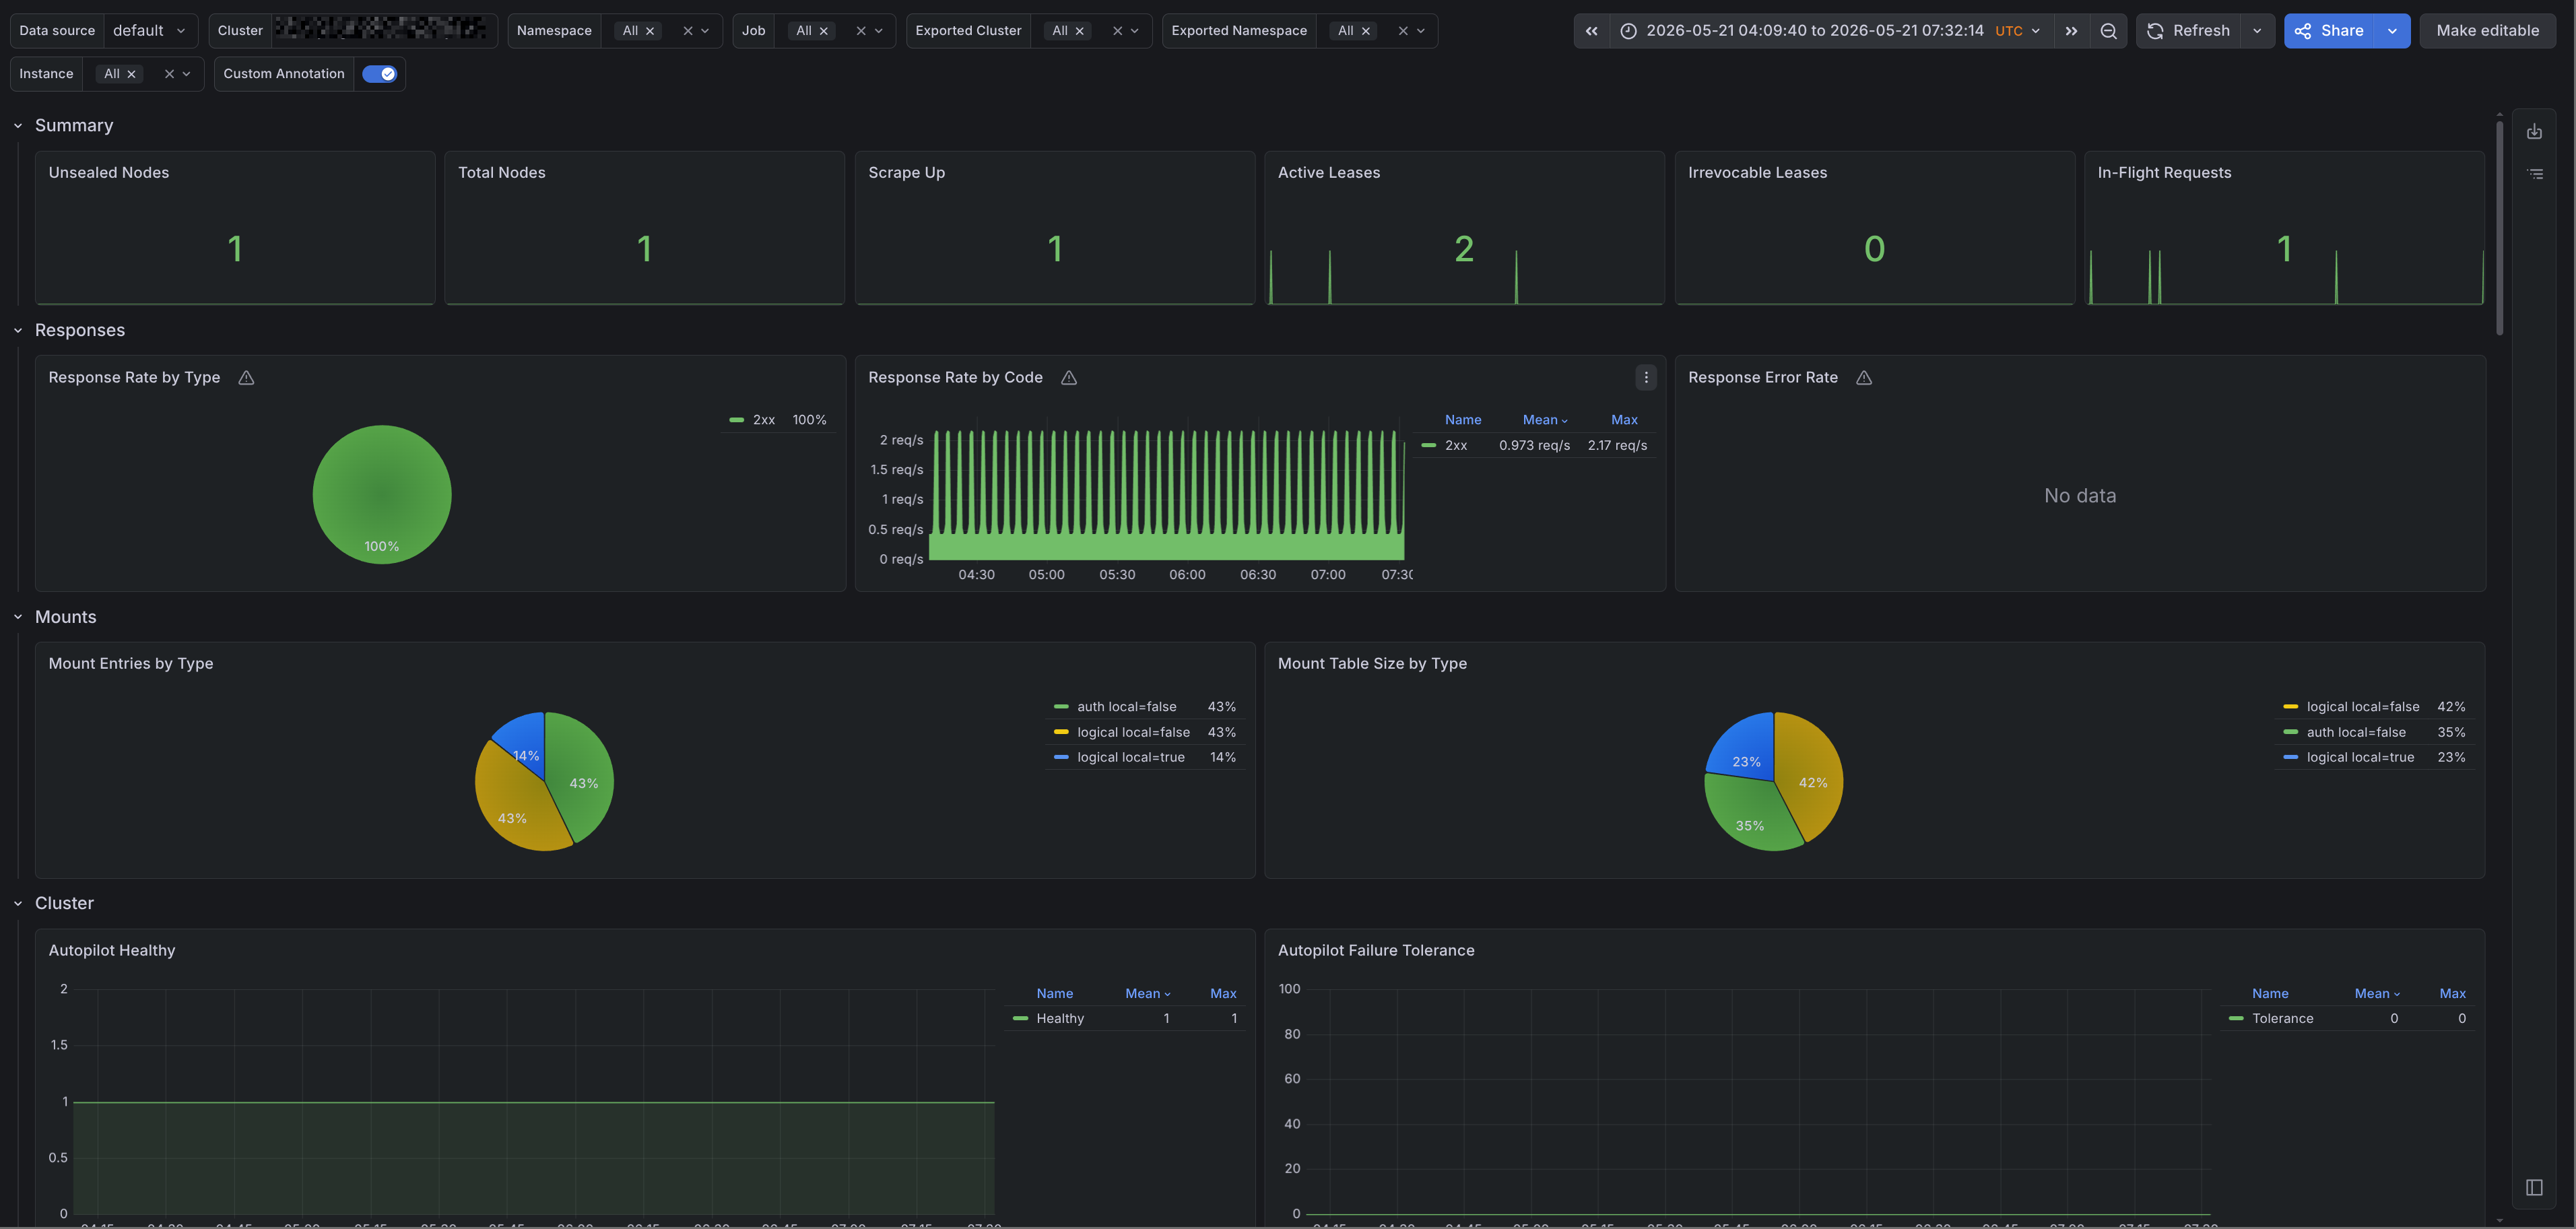
A dashboard that monitors Vault. It is created using the vault-mixin. For an in-depth view of Go runtime internals (CPU, memory, GC, scheduling, contention, file descriptor pressure), pair this dashboard with the Go / Overview dashboard from the go-mixin project.
Data source config
Collector config:
Upload an updated version of an exported dashboard.json file from Grafana
| Revision | Description | Created | |
|---|---|---|---|
| Download |
HashiCorp Vault
Easily monitor HashiCorp Vault, the secrets management tool, with Grafana Cloud's out-of-the-box monitoring solution.
Learn more