
Codex
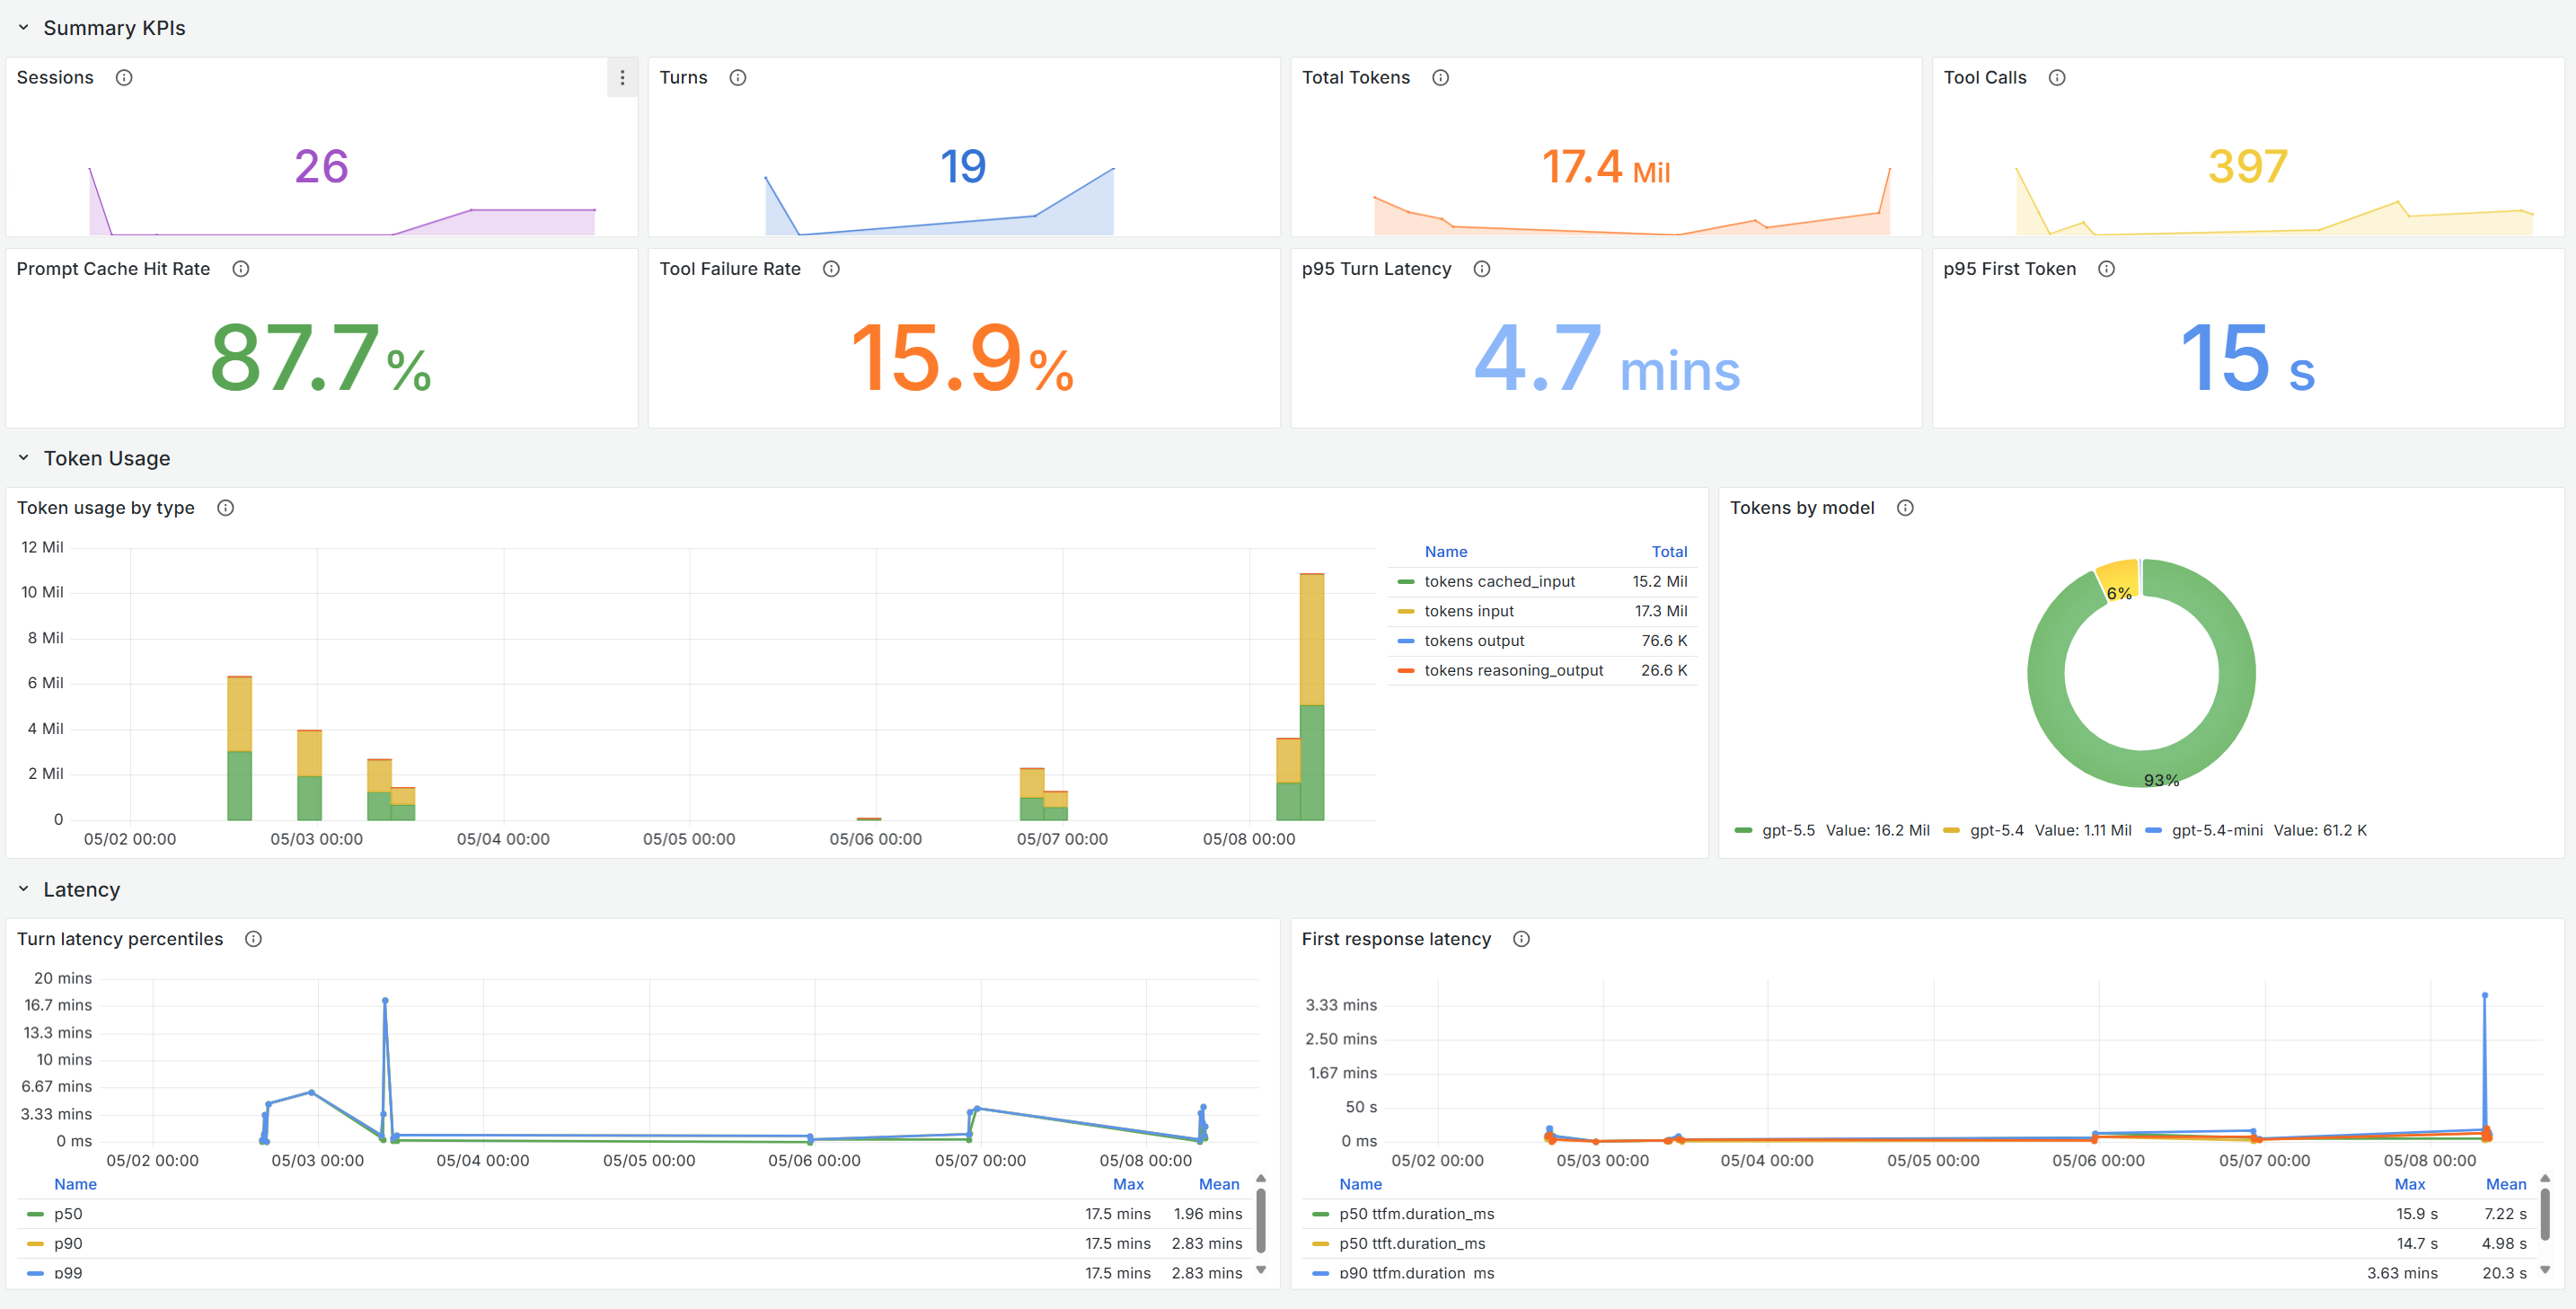
Monitoring dashboard for OpenAI Codex CLI usage and performance via Application Insights OpenTelemetry data. Tracks sessions, conversation turns, token consumption, tool calls, prompt cache efficiency, turn and time-to-first-token latency, tool reliability, sandbox/approval activity, and per-client session breakdown.
Codex
Monitoring dashboard for OpenAI Codex CLI usage and performance via Application Insights OpenTelemetry data. Tracks sessions, conversation turns, token consumption, tool calls, prompt cache efficiency, turn and time-to-first-token latency, tool reliability, sandbox/approval activity, and per-client session breakdown.
Screenshots

Issues and feedback
https://github.com/1w2w3y/grafana-dashboards/issues
Features
- Summary KPIs
- Sessions, Turns, Total Tokens, Tool Calls
- Prompt Cache Hit Rate, Tool Failure Rate
- p95 Turn Latency, p95 First Token
- Token Usage
- Token usage by type (input / output / cached / reasoning)
- Tokens by model
- Latency
- Turn latency percentiles (p50 / p90 / p95)
- First response latency (TTFT)
- Usage Over Time
- Sessions over time
- Turns over time
- Tool Health
- Tool reliability by tool (success vs failure)
- Tool latency by tool
- Safety & Access
- Tool calls by sandbox policy
- Approval outcomes
- Sessions by client
How it works
- Grafana queries Application Insights via the Azure Monitor data source using Log Analytics (KQL) queries against OpenTelemetry data ingested into the
customMetricstable, filtered bycloud_RoleName startswith 'codex'. - Metric names follow the
codex.*naming scheme — e.g.codex.thread.started,codex.conversation.turn.count,codex.turn.token_usage,codex.turn.e2e_duration_ms,codex.turn.ttft.duration_ms,codex.tool.call,codex.tool.call.duration_ms,codex.approval.requested. - Variables:
am_ds— Azure Monitor data sourcesub— Azure subscriptionrg— Resource group (resolved via Azure Resource Graph formicrosoft.insights/components)res— Application Insights resource
- Default time range is 7 days; default refresh 30 minutes.
Requirements
- Grafana 11.6+ with the Azure Monitor data source configured with access to the subscription containing your Application Insights resource.
- Codex CLI telemetry data flowing into Application Insights via OpenTelemetry. See Ingest data into Application Insights via OpenTelemetry Collector for the end-to-end setup — running the OTel Collector with the Azure Monitor Exporter, the Codex CLI OTLP configuration (
OTEL_EXPORTER_OTLP_ENDPOINT, service namecodex), and KQL verification queries againstcustomMetrics.
Change history
- 5/8/2026 Initial version
Data source config
Collector config:
Upload an updated version of an exported dashboard.json file from Grafana
| Revision | Description | Created | |
|---|---|---|---|
| Download |