
NVIDIA DCGM Exporter Dashboard
This dashboard is to display the metrics from DCGM Exporter on a Kubernetes (1.34+) cluster
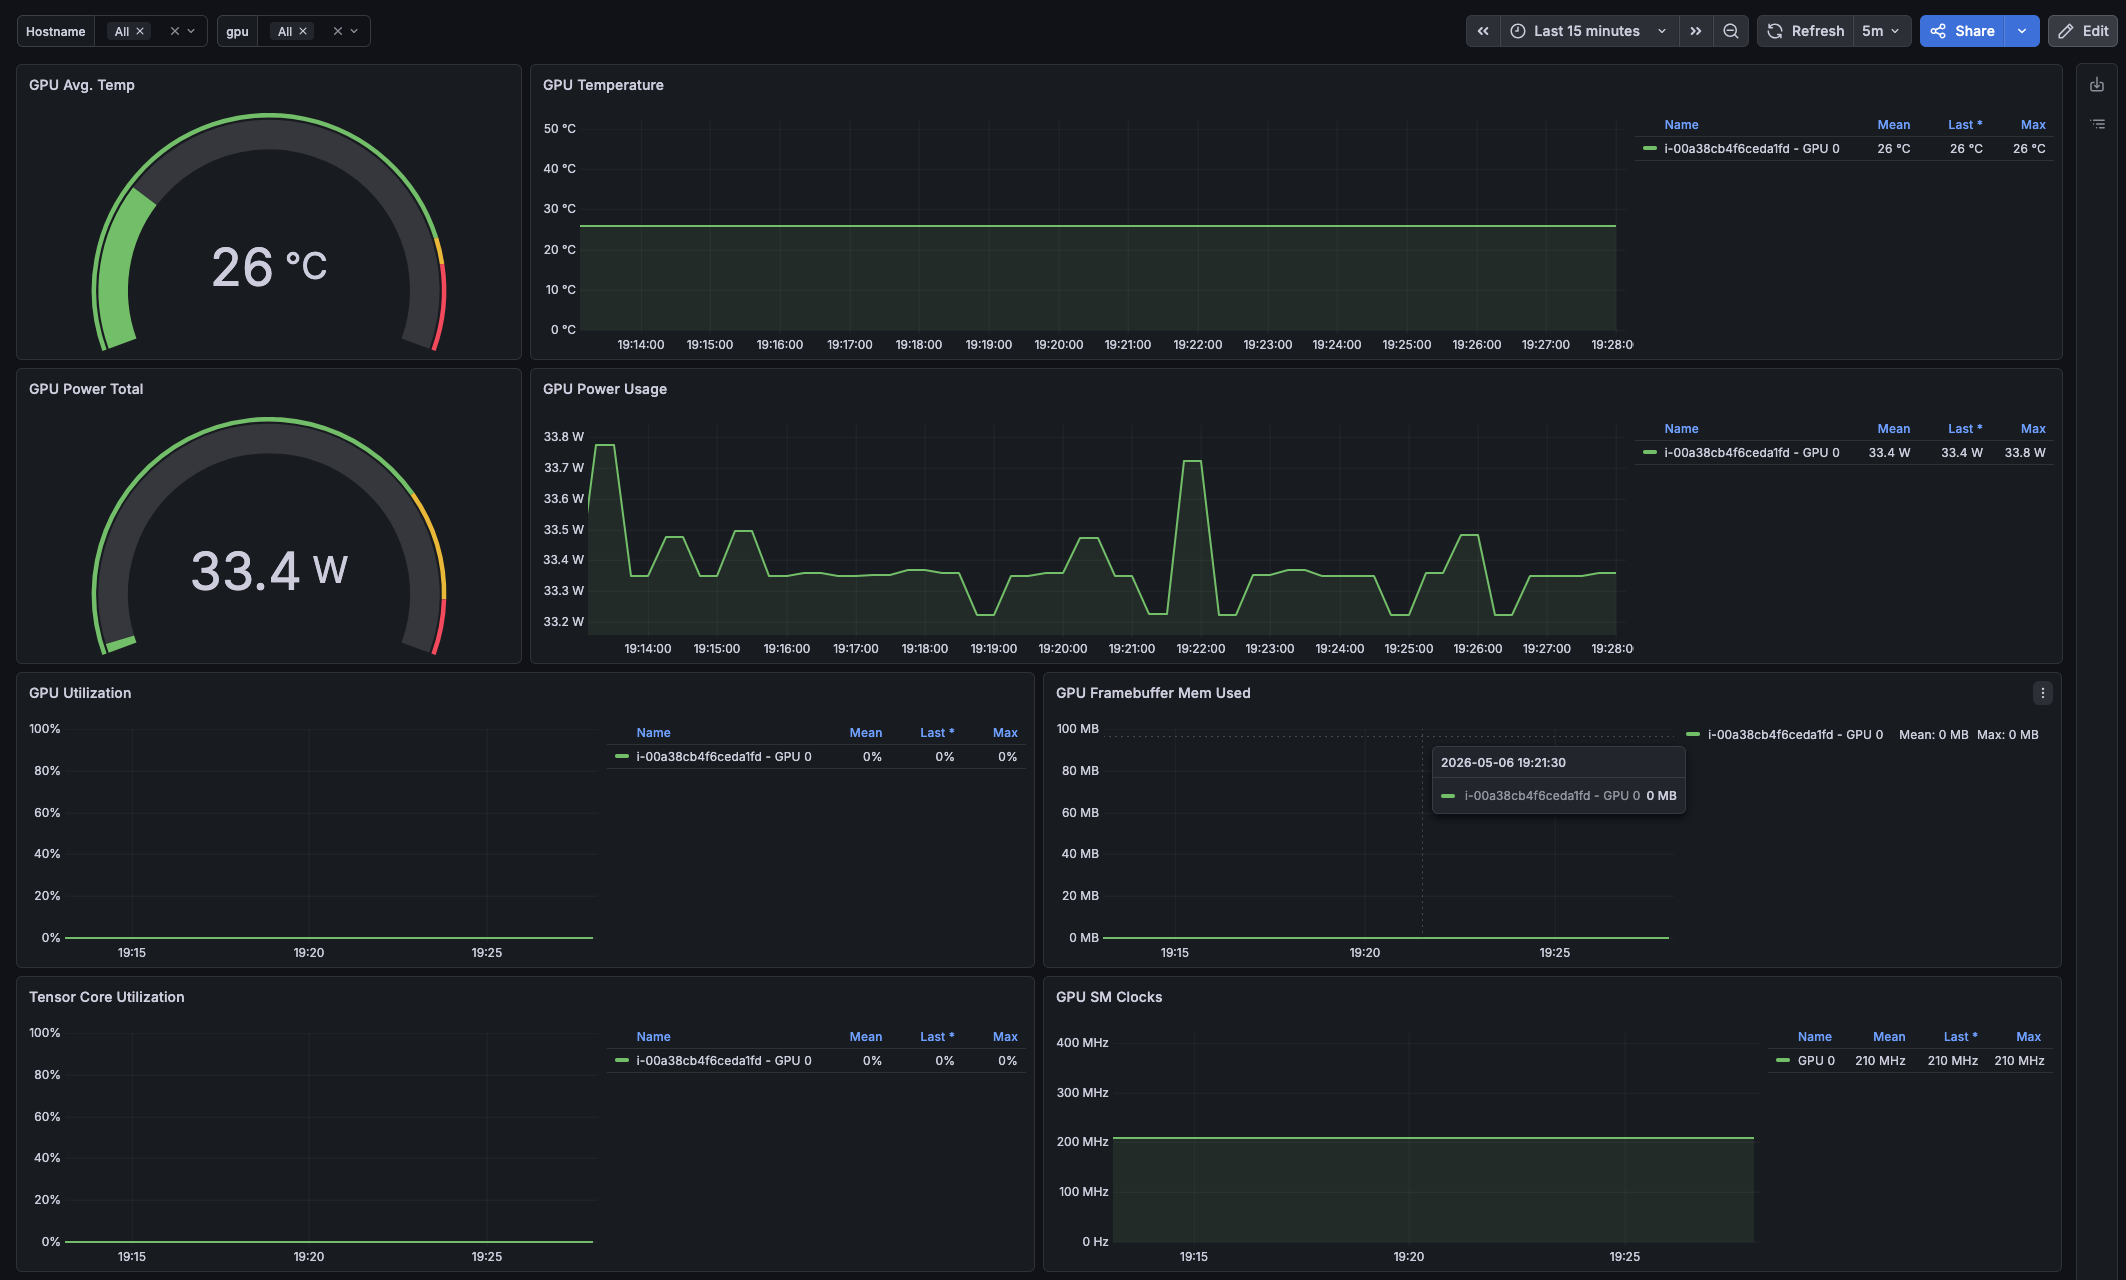
This dashboard is used in EKS AI/ML User Guide Cluster Set Up CLI Monitoring section. The guide provides instructions how to set up Prometheus, Grafana, and DCGM exporter custom metrics.
Data source config
Collector type:
Collector plugins:
Collector config:
Revisions
Upload an updated version of an exported dashboard.json file from Grafana
| Revision | Description | Created | |
|---|---|---|---|
| Download |