Nginx Log Exporter Dashboard
Grafana dashboard for martin-helmich/prometheus-nginxlog-exporter, focused on traffic, latency, reliability, route-level insights, and parser health.
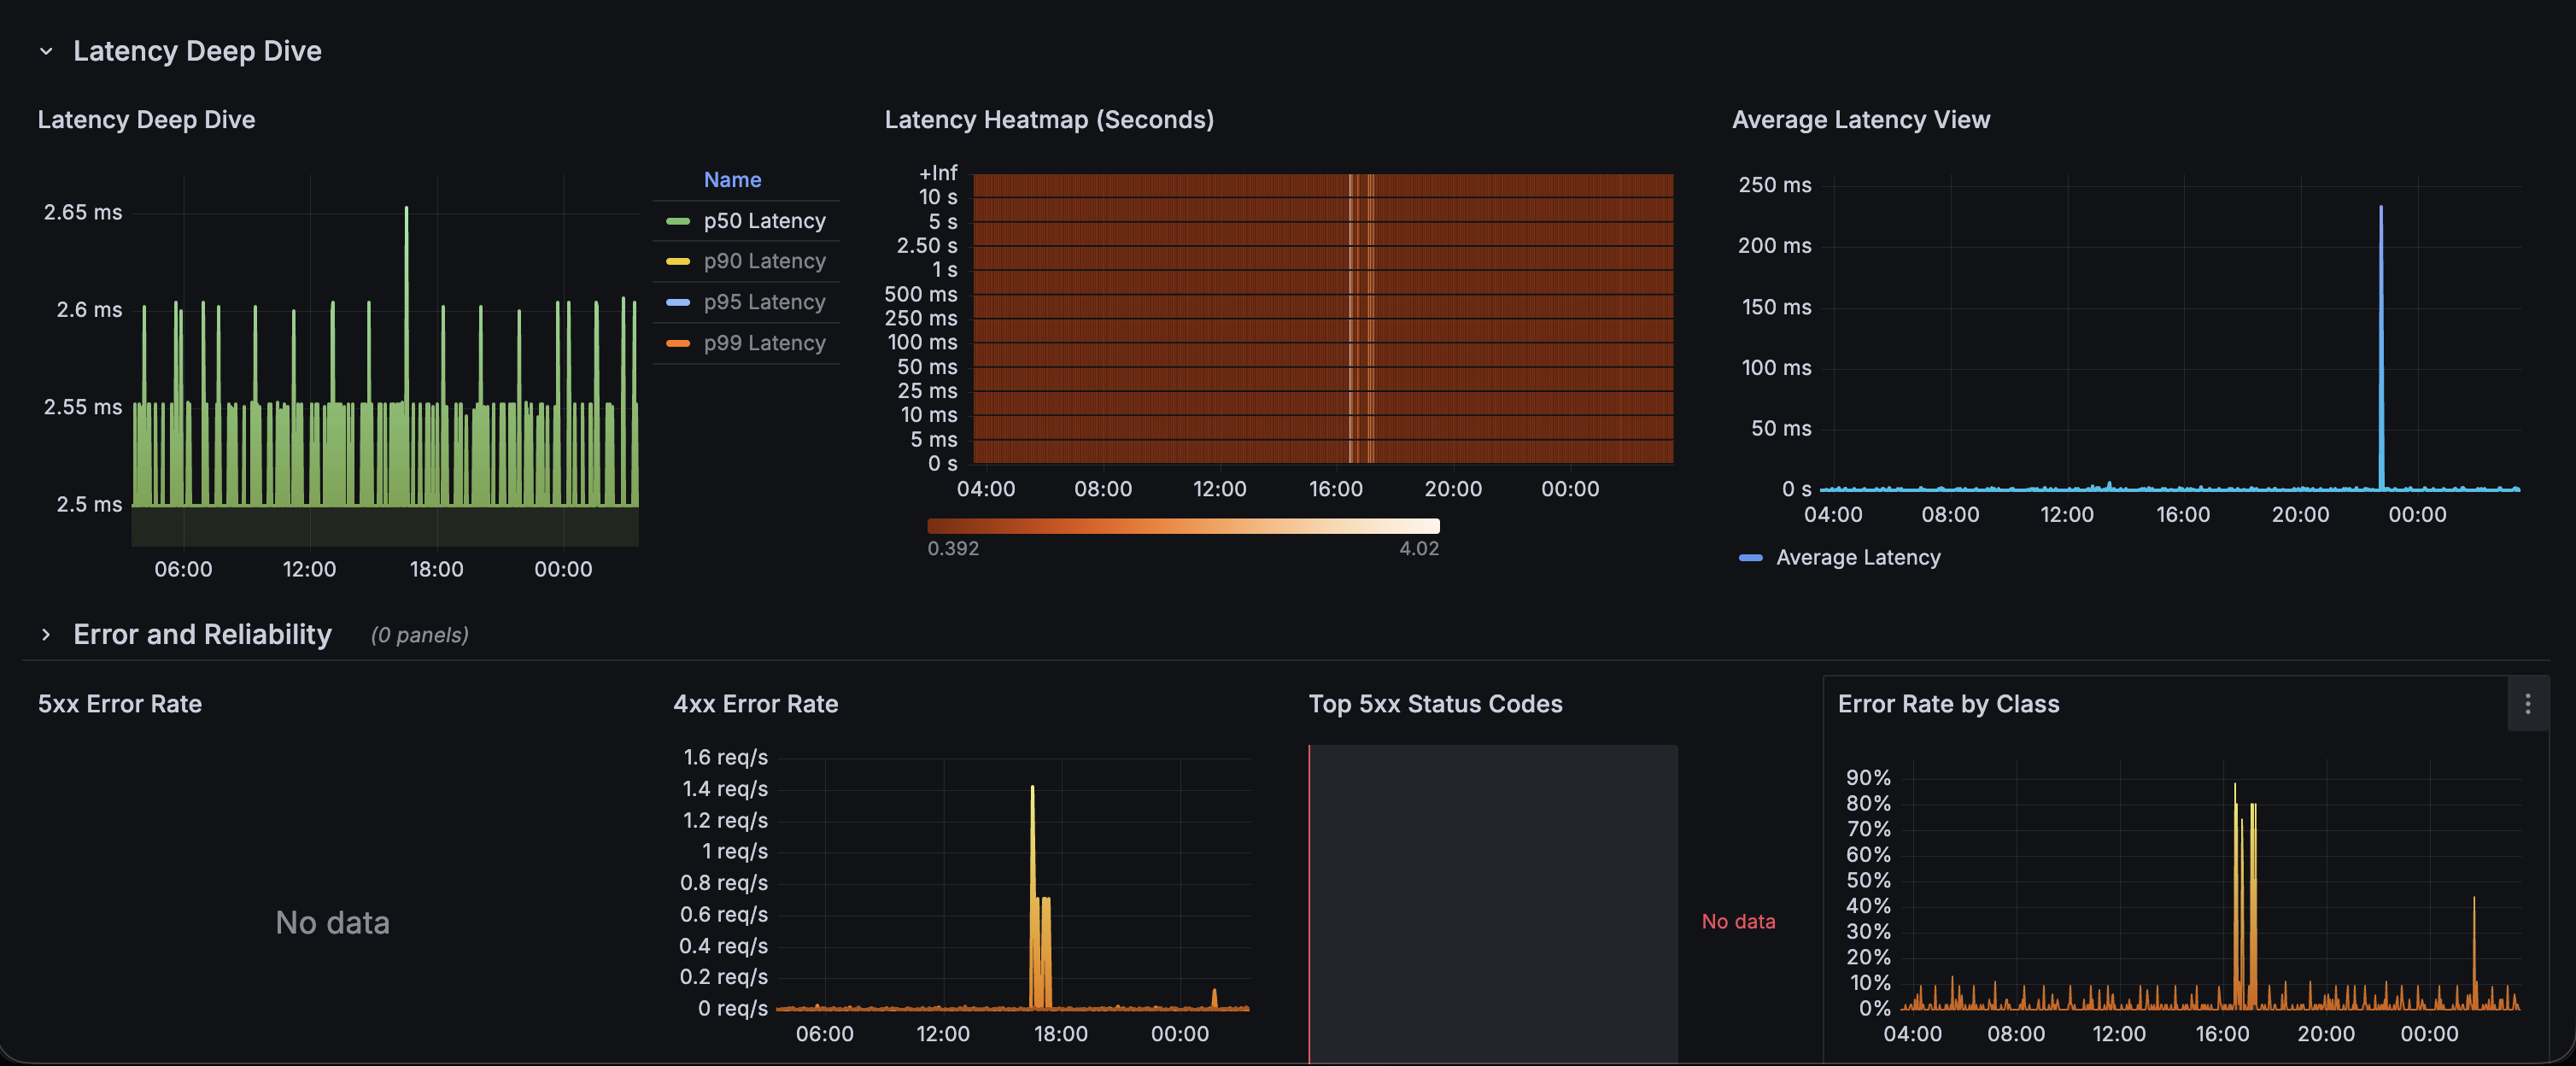
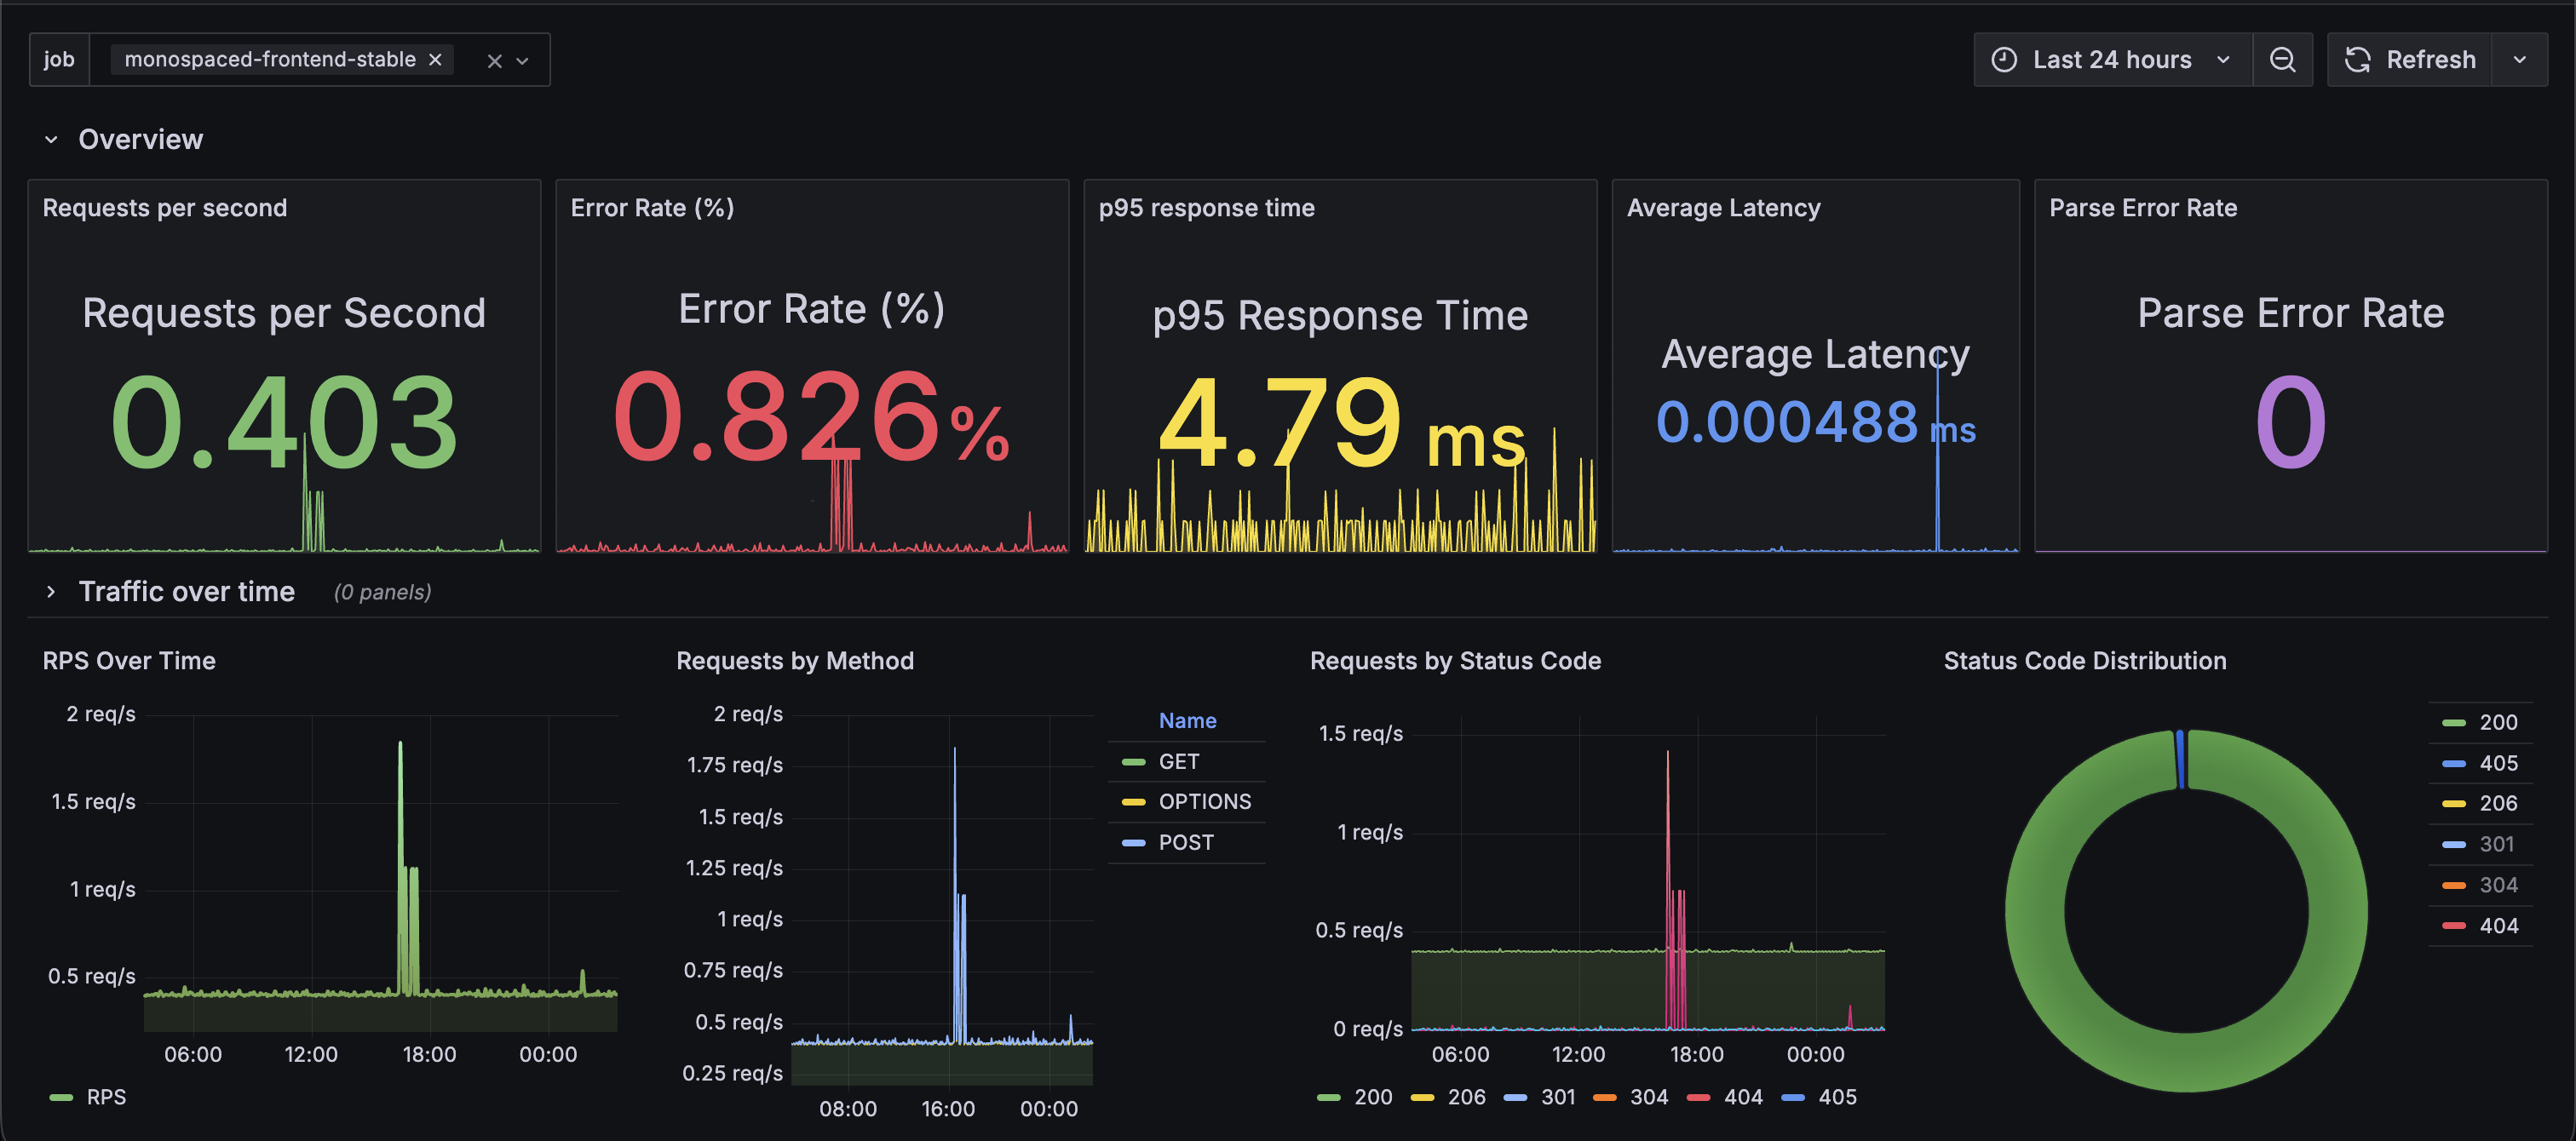
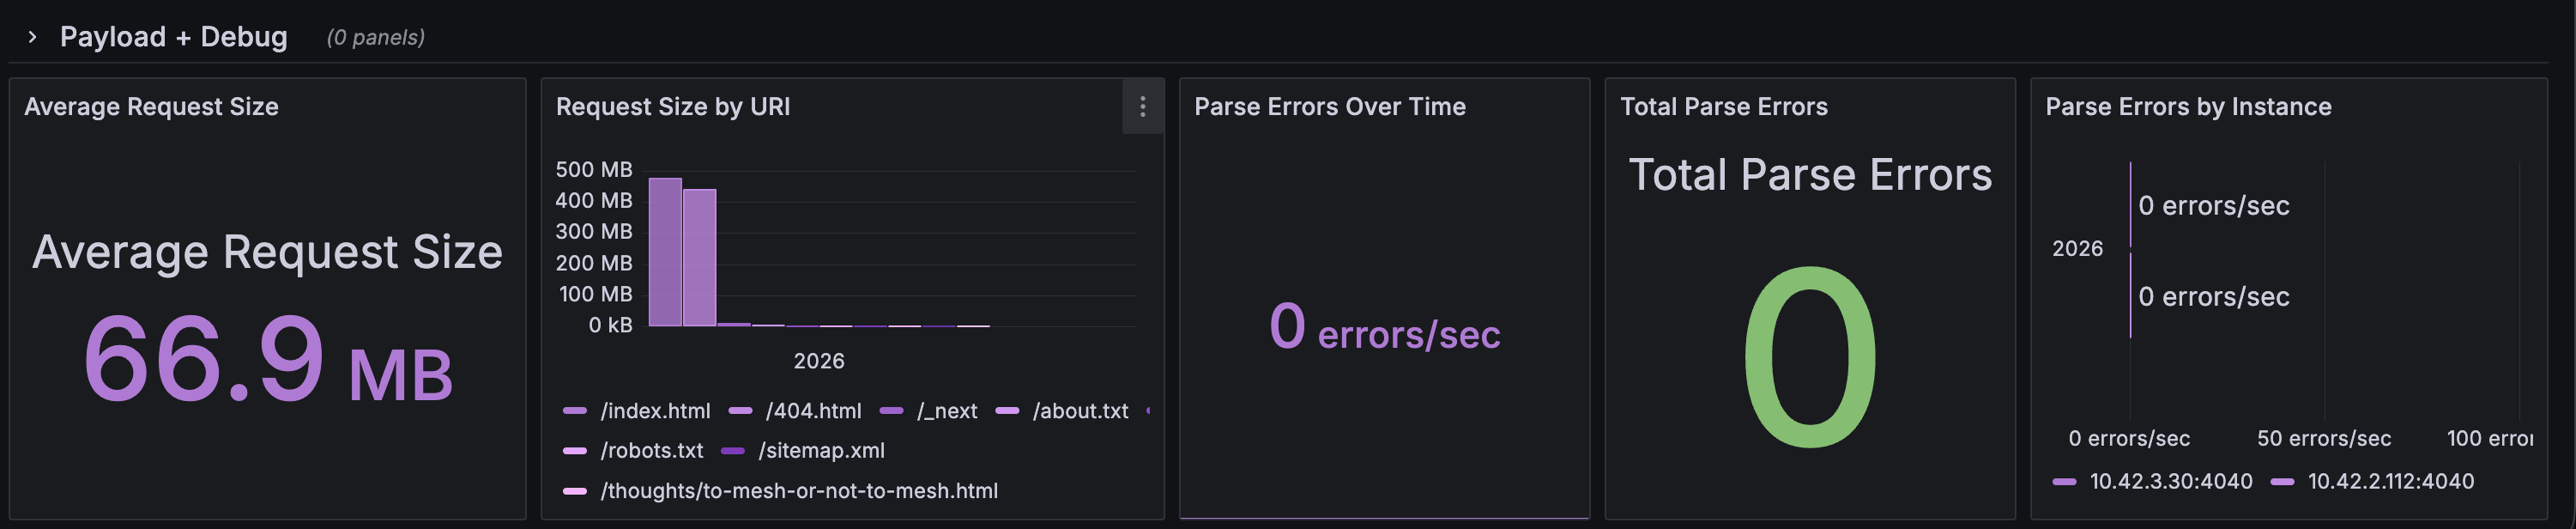
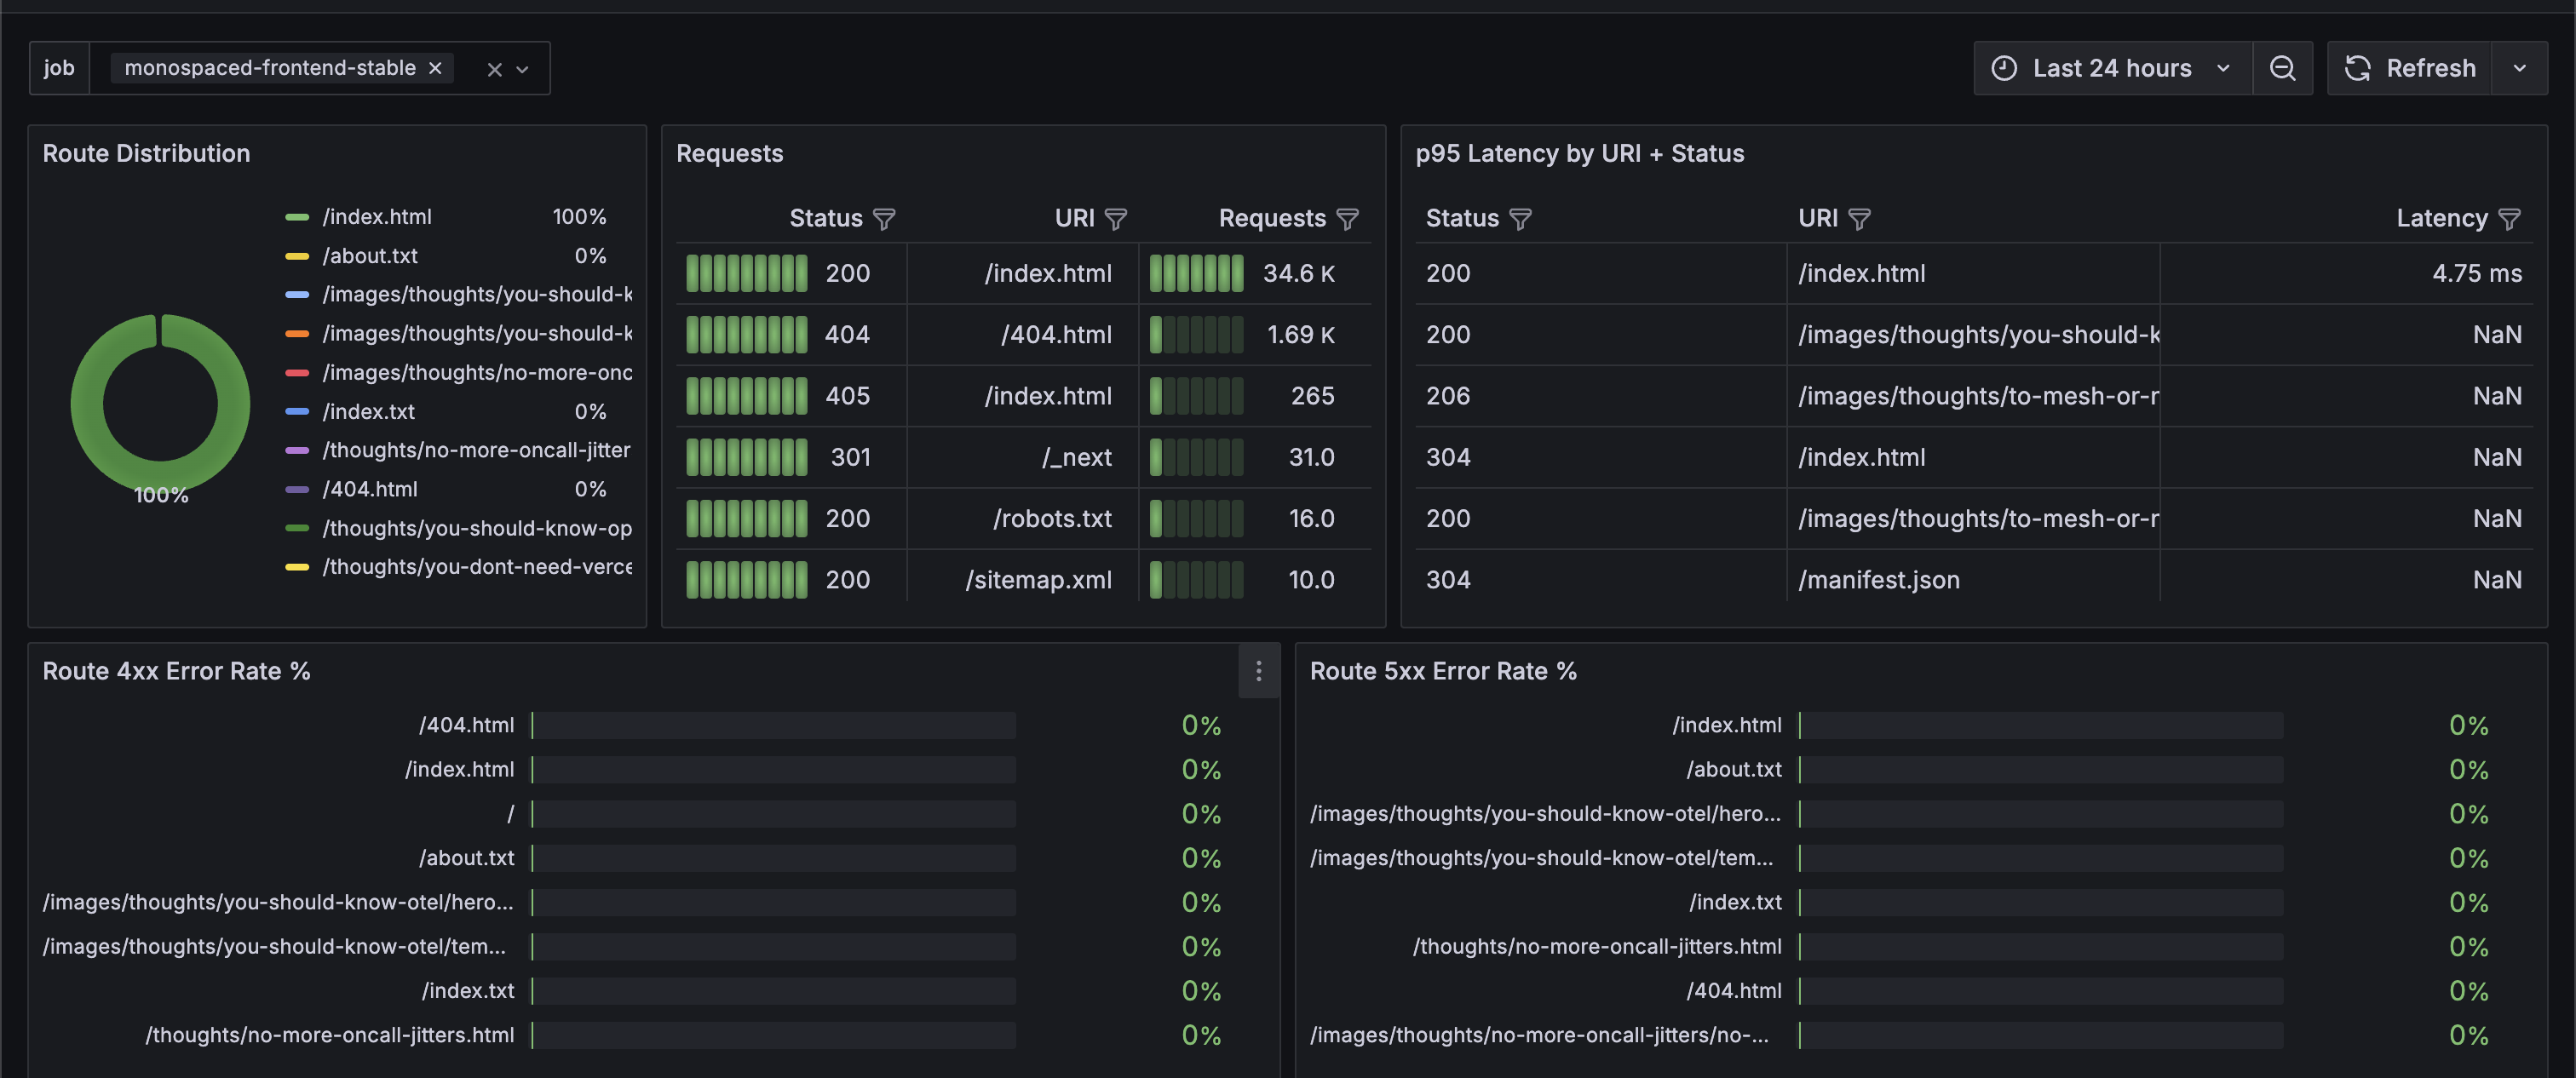
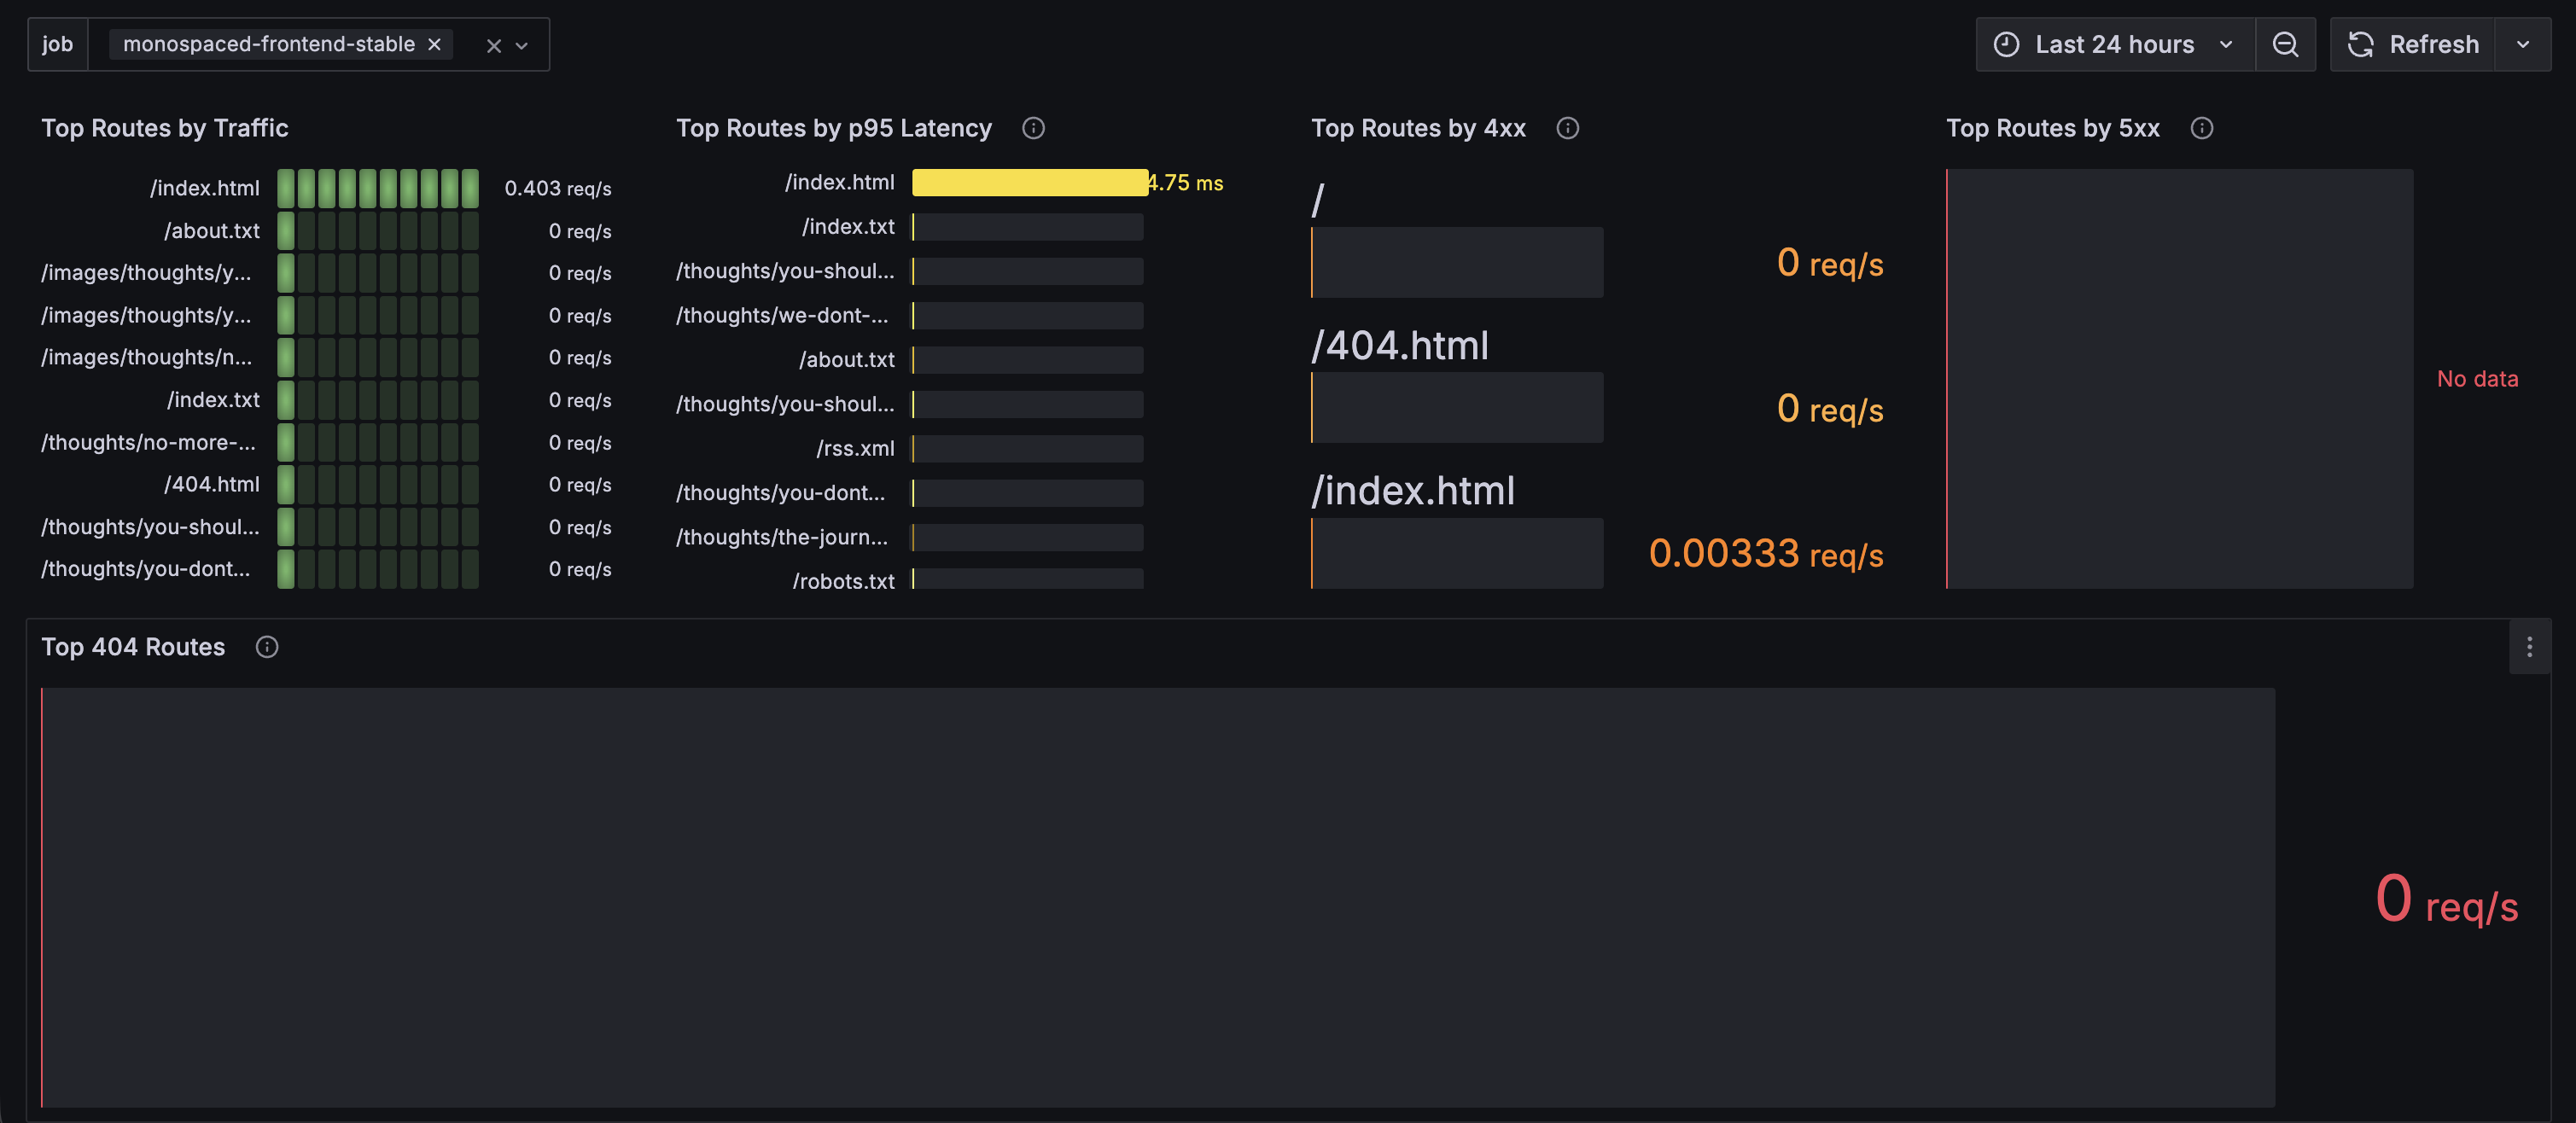
The Nginx Log Exporter Dashboard dashboard uses the prometheus data source to create a Grafana dashboard with the barchart, bargauge, heatmap, piechart, stat, table and timeseries panels.
Data source config
Collector type:
Collector plugins:
Collector config:
Revisions
Upload an updated version of an exported dashboard.json file from Grafana
| Revision | Description | Created | |
|---|---|---|---|
| Download |
NGINX
Easily monitor NGINX, an open source software for web serving, reverse proxying, caching, load balancing, media streaming, and more, with Grafana Cloud's out-of-the-box monitoring solution.
Learn more