
NUT UPS Monitor for Prometheus
Monitor UPS status, battery charge, load, input/output voltage, battery voltage, frequency, temperature, beeper status, and status timeline via Network UPS Tools and prometheus-nut-exporter. Tested with Aplus UPS using nutdrv_qx.
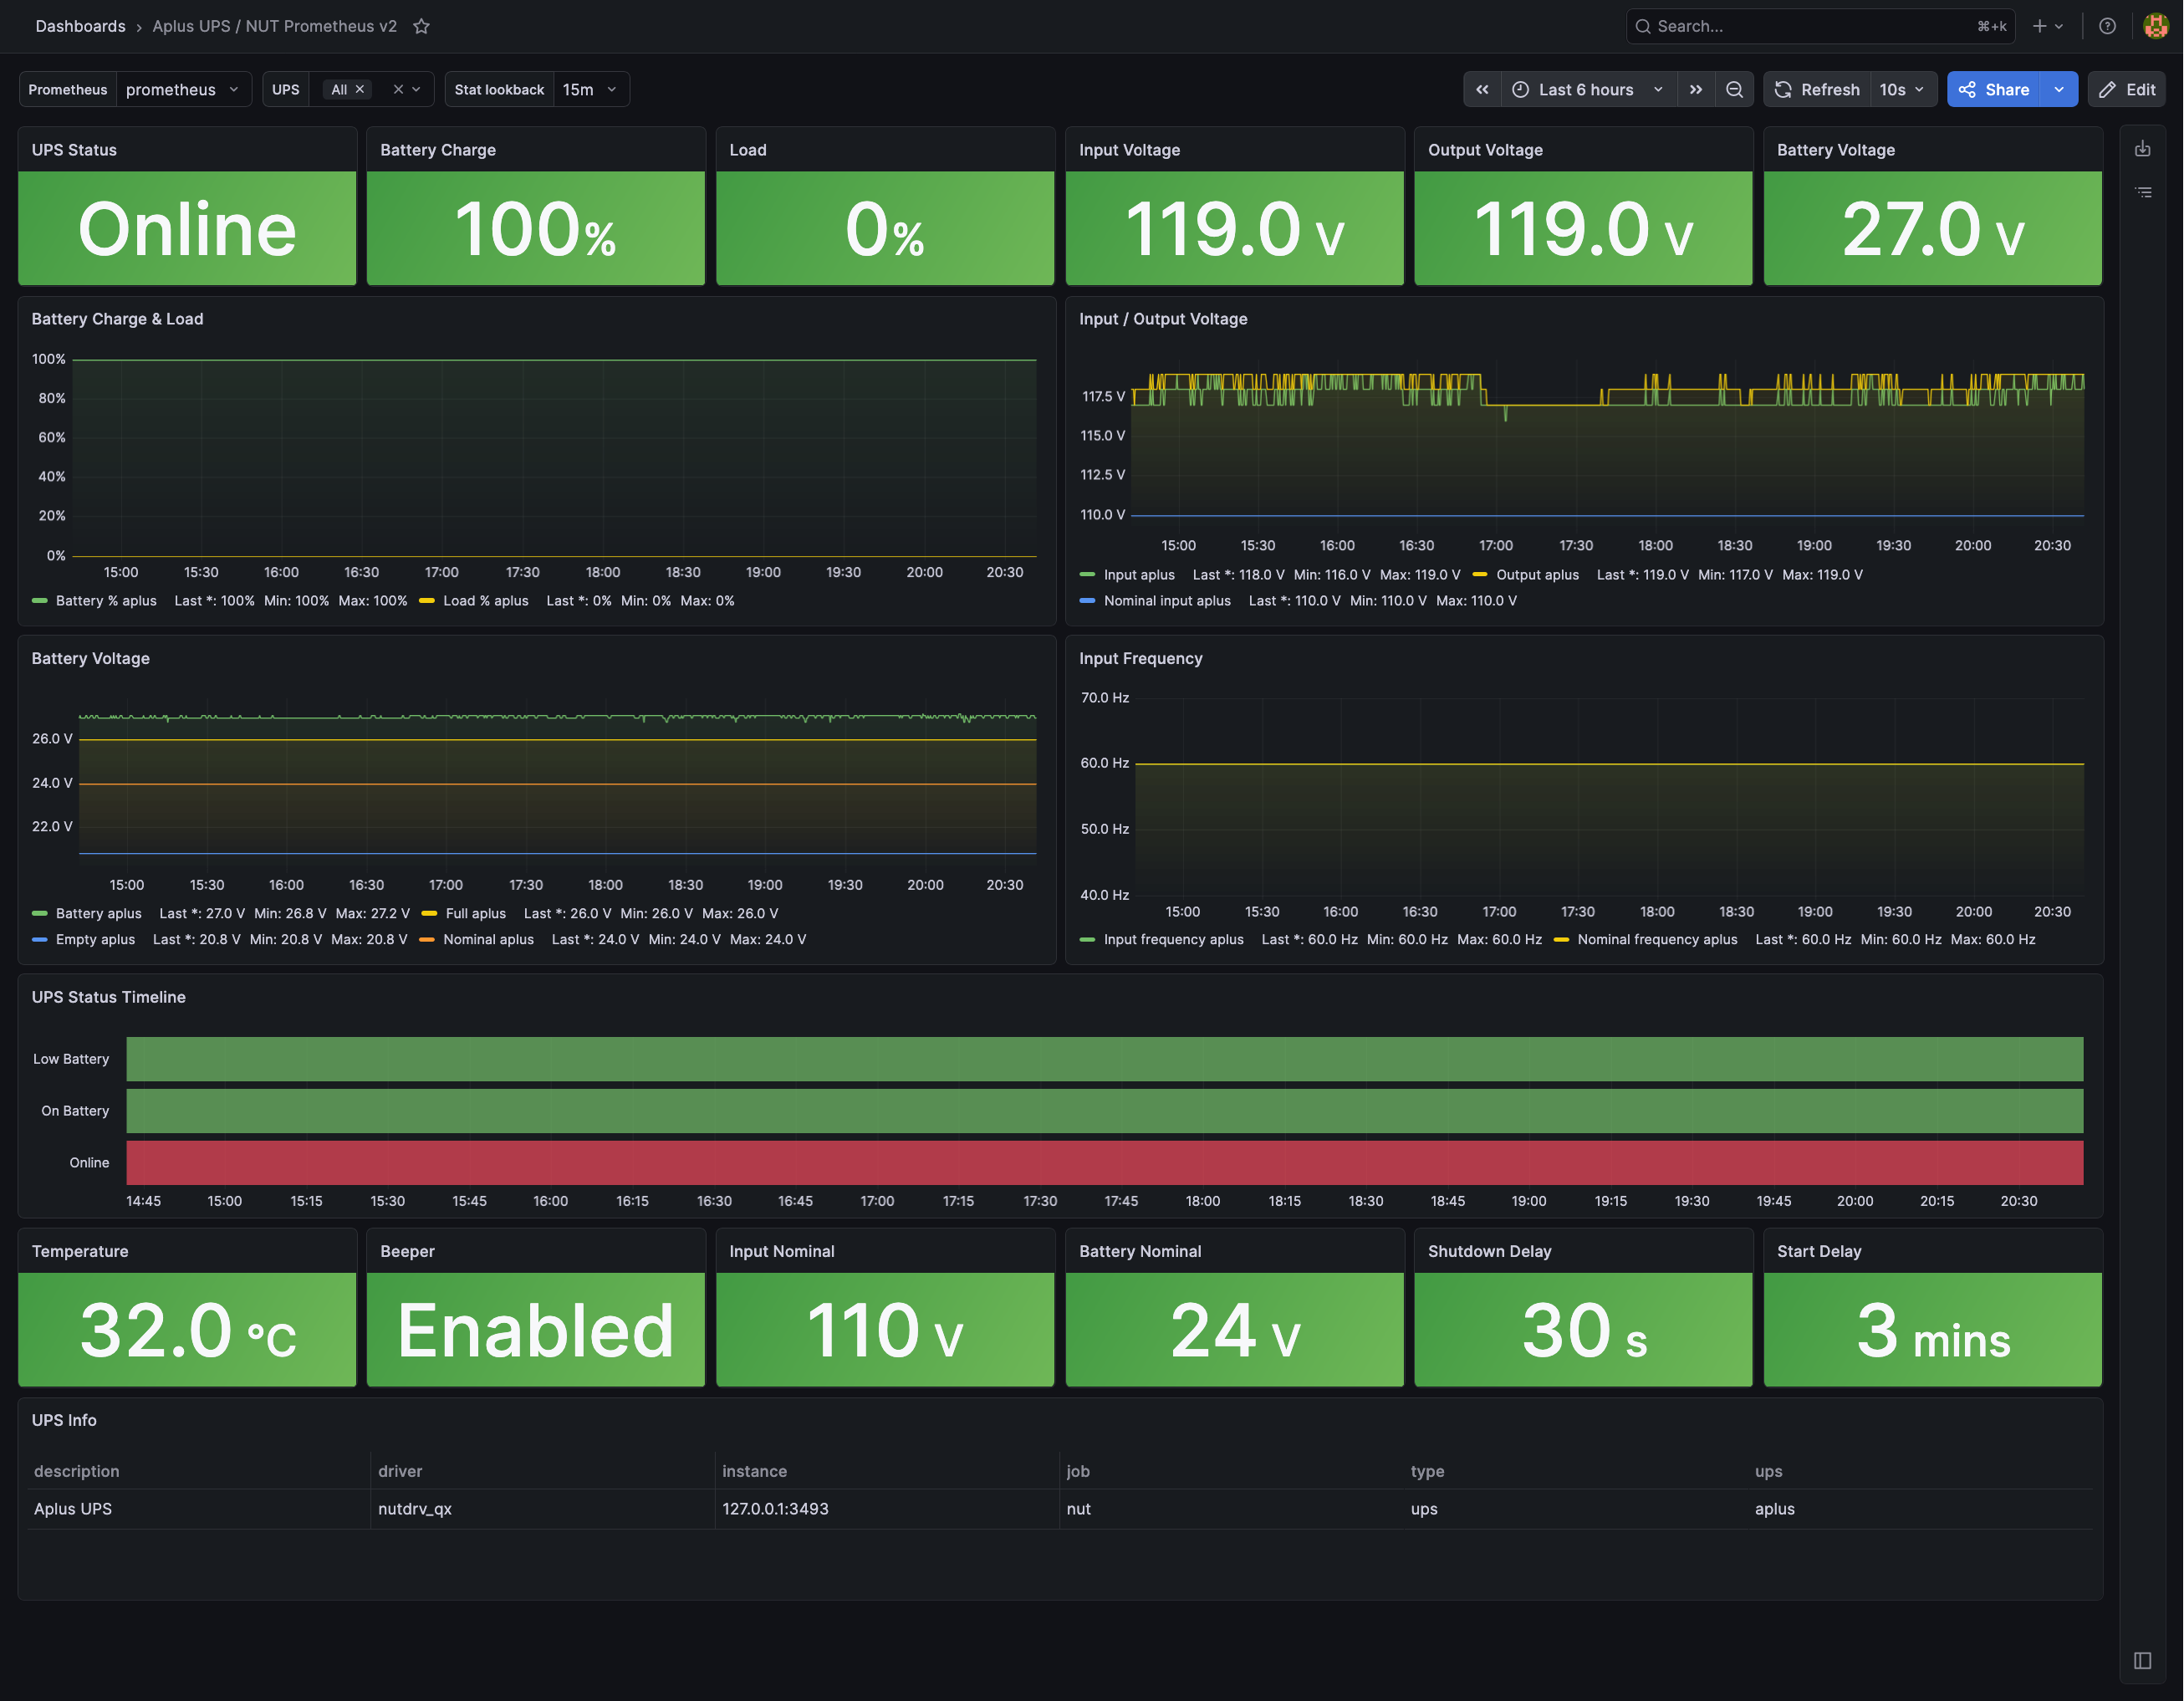
The NUT UPS Monitor for Prometheus dashboard uses the prometheus data source to create a Grafana dashboard with the panel.
Data source config
Collector type:
Collector plugins:
Collector config:
Revisions
Upload an updated version of an exported dashboard.json file from Grafana
| Revision | Description | Created | |
|---|---|---|---|
| Download |

Metrics Endpoint (Prometheus)

Easily monitor any Prometheus-compatible and publicly accessible metrics URL with Grafana Cloud's out-of-the-box monitoring solution.
Learn more