
MongoDB — Prod Overview
Production-grade MongoDB observability — ops, latency, connections, WiredTiger, replication, DB stats, profiler.
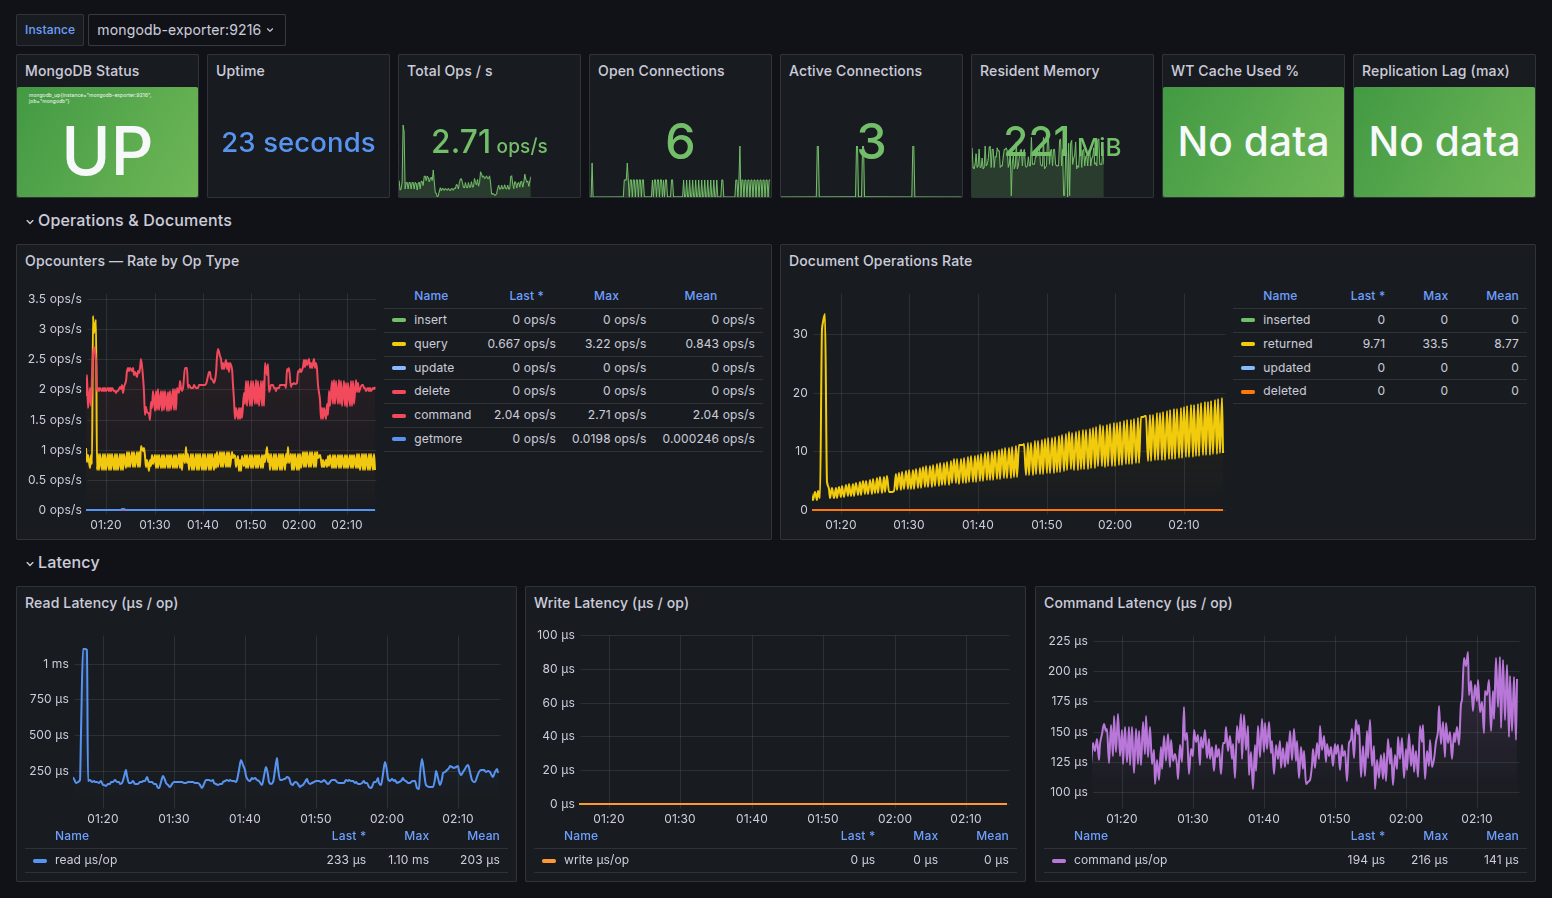
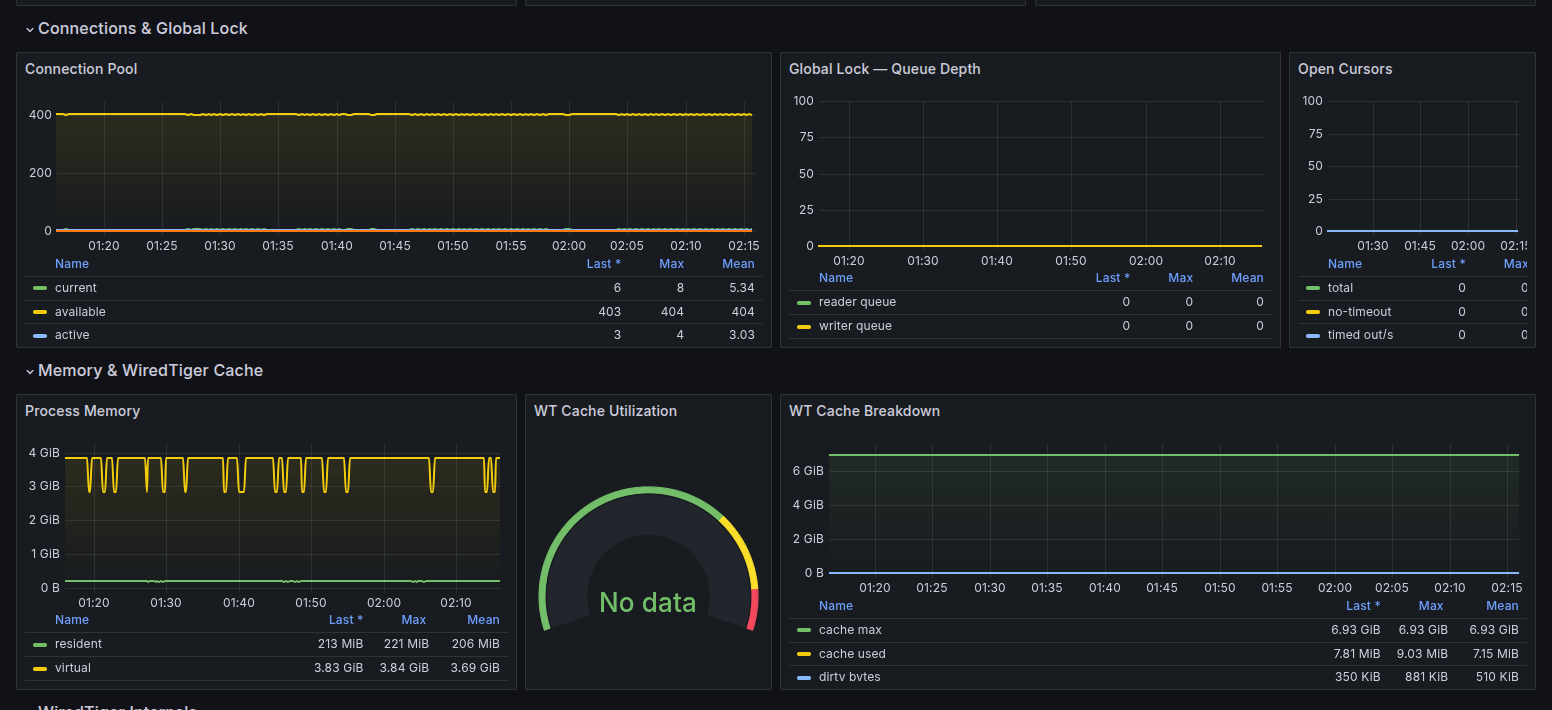
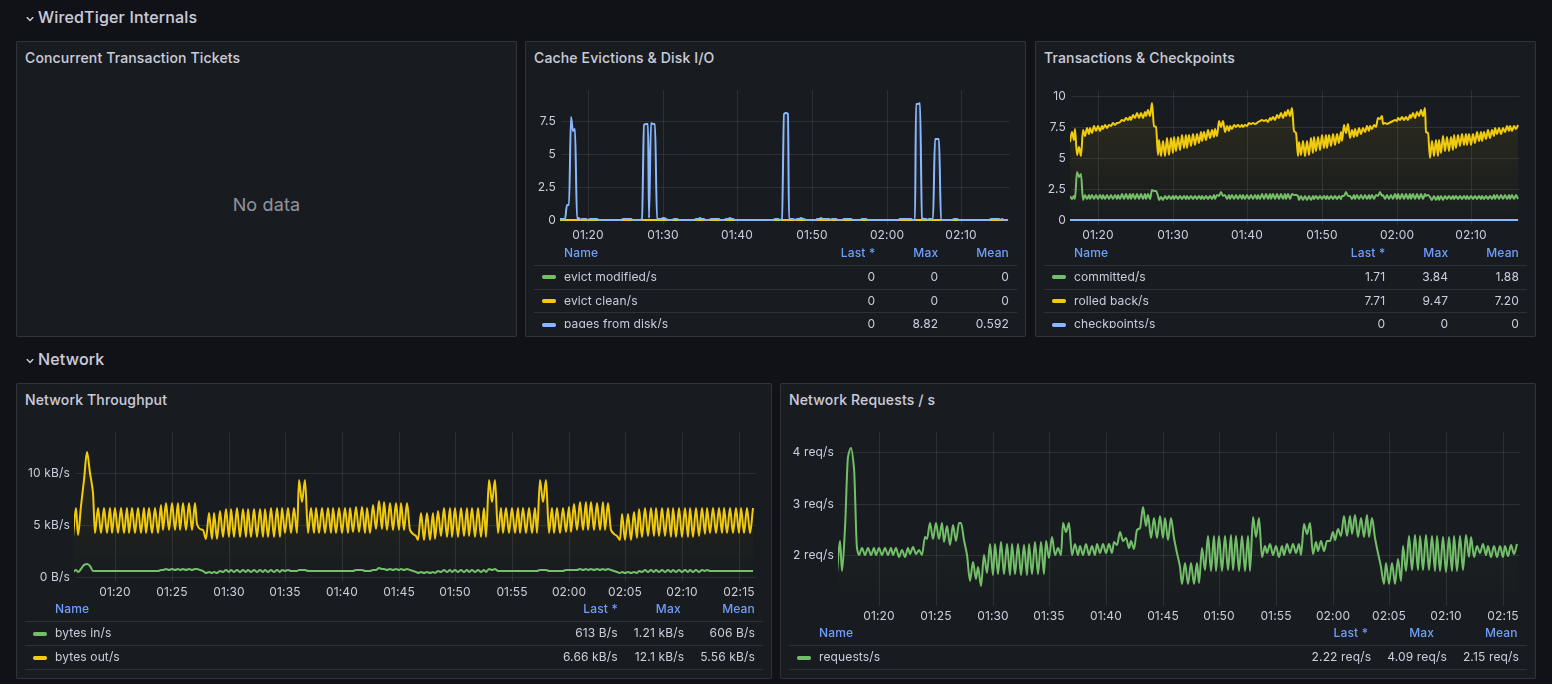
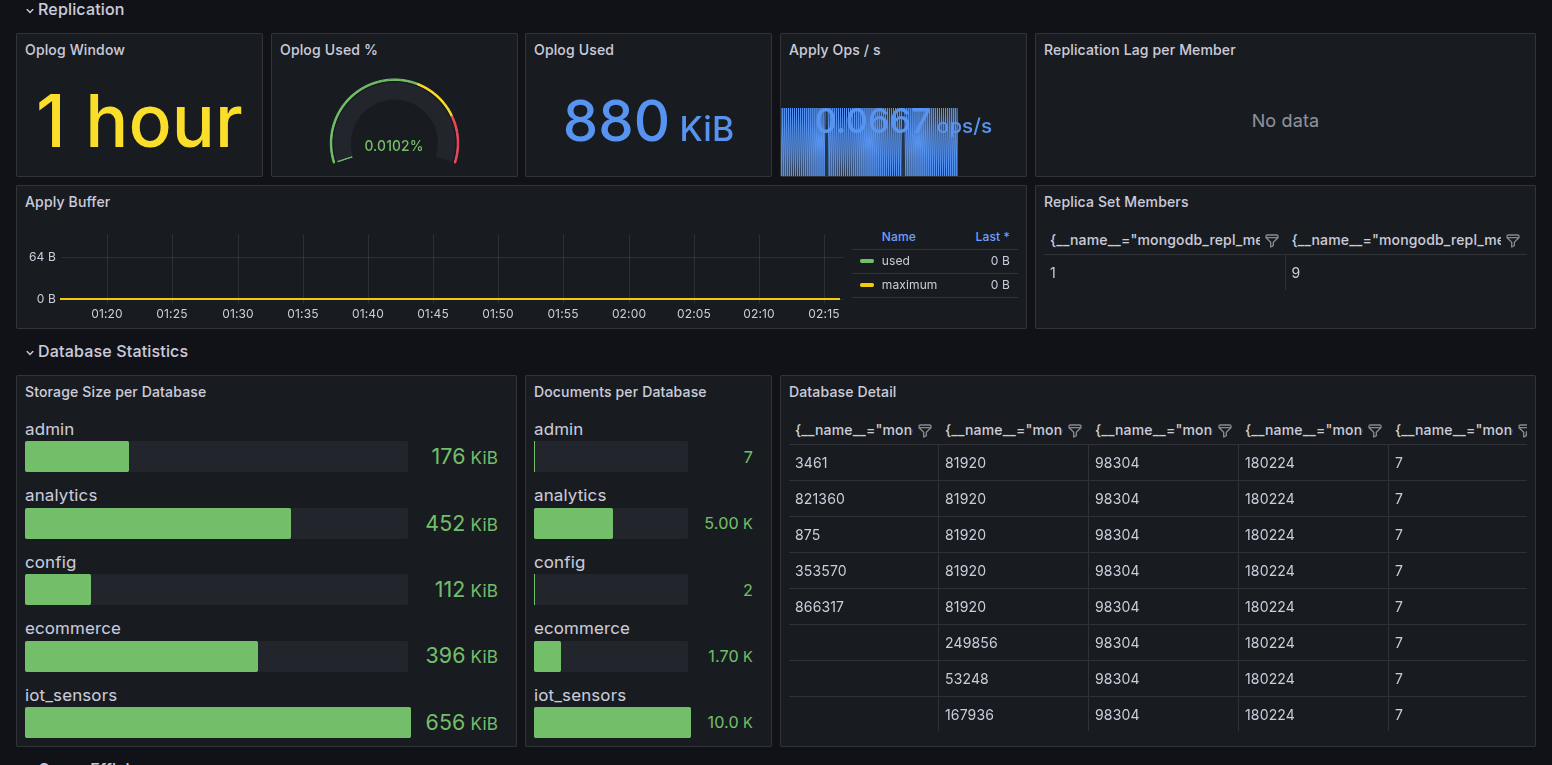
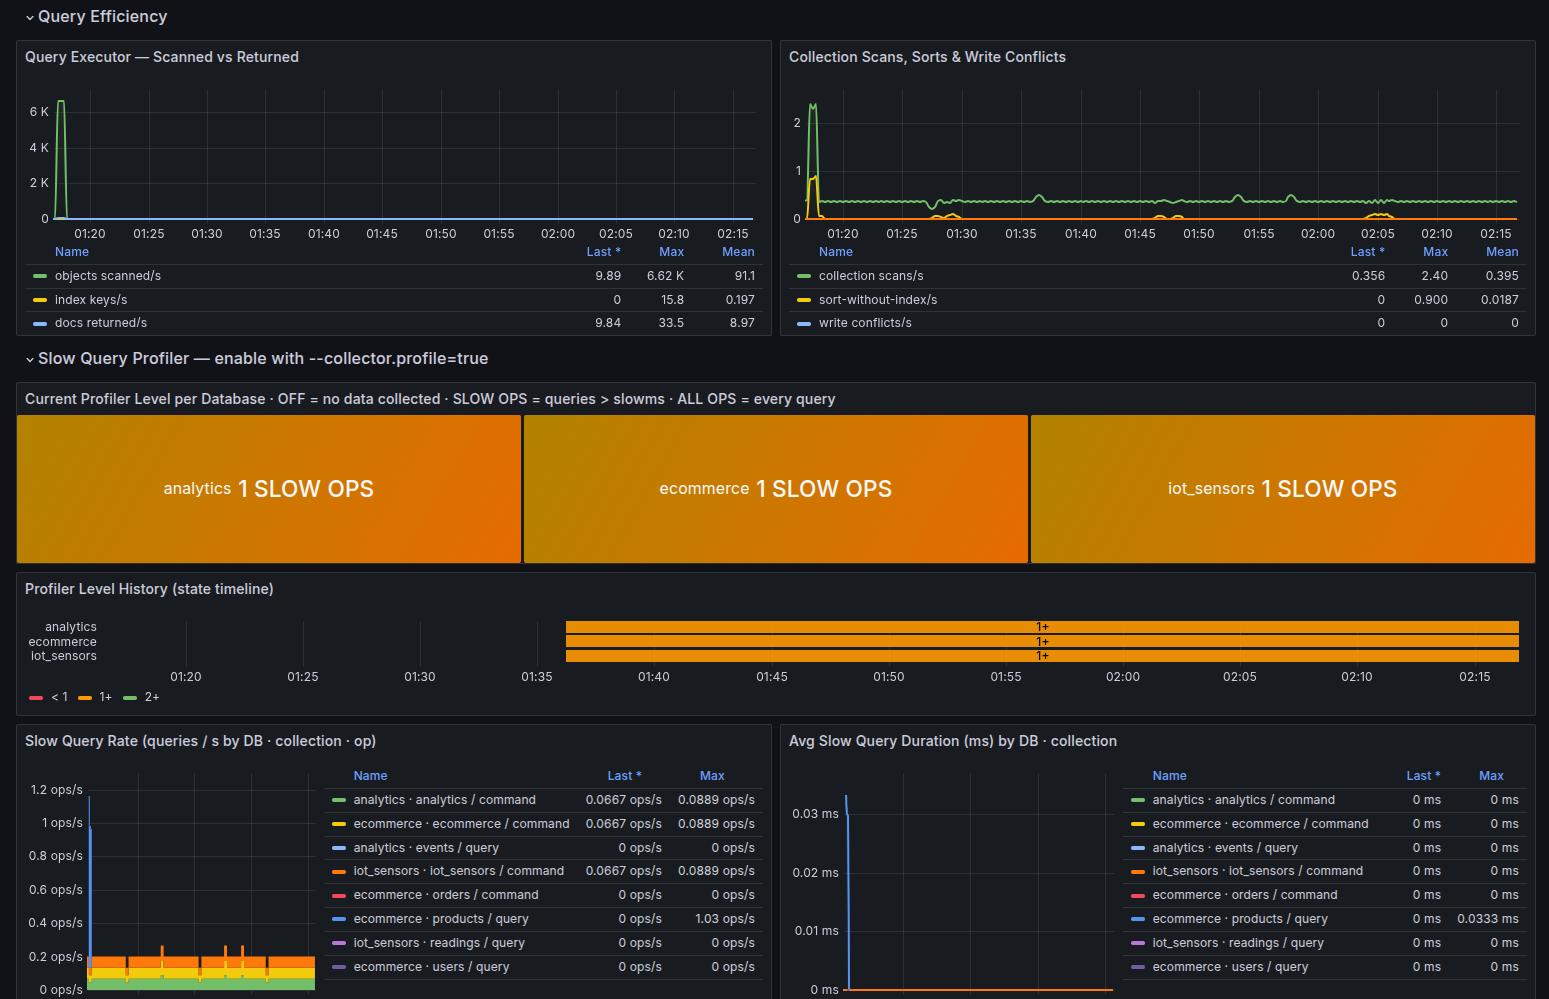
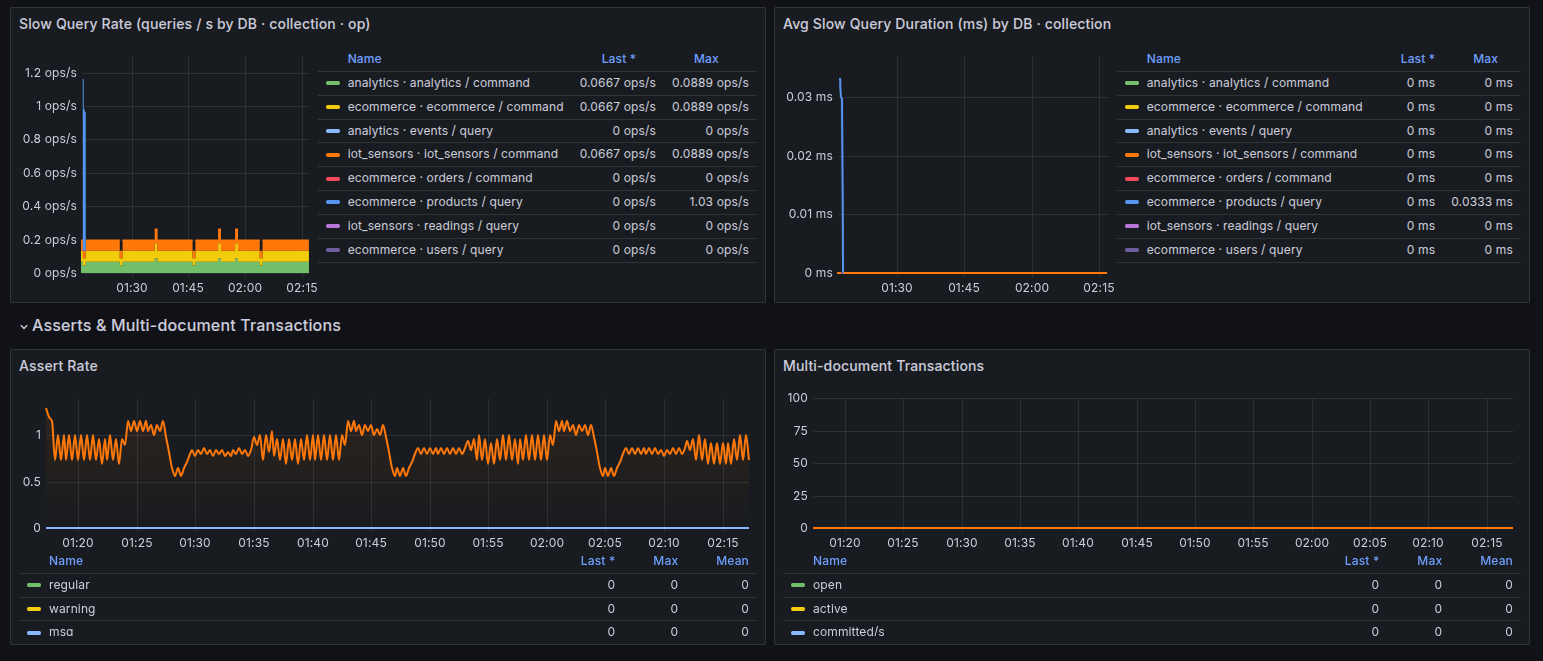
MongoDB — Production Overview
53-panel production-grade MongoDB monitoring dashboard for mongodb-exporter — a lightweight, purpose-built Prometheus exporter written in Go.
GitHub: https://github.com/gurjarchetan/mongodb-exporter
What this dashboard shows
The dashboard is organised into 7 rows:
| Row | Panels | What it tells you |
|---|---|---|
| Status | MongoDB Up, Uptime, Ops/s, Open Connections, Active Connections, Resident Memory, WiredTiger Cache %, Replication Lag | At-a-glance health of the instance |
| Operations & Latency | Opcounters time-series, Read latency, Write latency, Command latency | Throughput trends and response-time breakdowns by operation type |
| Connections | Current / available / created rate | Connection pool pressure over time |
| WiredTiger Internals | Cache reads/writes, evictions, pages read/written, concurrent transactions | Storage engine deep-dive for performance tuning |
| Database Statistics | Storage size bar gauge (per DB), Documents bar gauge (per DB), detail table with Total Size colour-coding | Capacity planning across databases |
| Replica Set | RS member table (role, health, uptime, replication lag with threshold colouring) | Replica-set topology and lag monitoring |
| Slow Query Profiler | Profiling level stat per database (colour-coded: OFF / SLOW OPS / ALL OPS), profiler level state-timeline history | Real-time visibility into MongoDB's built-in query profiler state |
How metrics are collected
Metrics are scraped by mongodb-exporter — a Go binary that exposes a /metrics Prometheus endpoint (default port 9216).
Collectors and their MongoDB sources:
| Collector | MongoDB command | Key metrics |
|---|---|---|
serverStatus | db.runCommand({serverStatus: 1}) | mongodb_opcounters_*, mongodb_connections_*, mongodb_mem_*, mongodb_uptime_seconds, mongodb_up |
wiredTiger | embedded in serverStatus | mongodb_wiredtiger_cache_*, mongodb_wiredtiger_concurrent_transactions_* |
dbStats | db.runCommand({dbStats: 1}) per database | mongodb_dbstats_storage_size_bytes, mongodb_dbstats_objects, mongodb_dbstats_data_size_bytes, mongodb_dbstats_indexes |
replSetGetStatus | db.adminCommand({replSetGetStatus: 1}) | mongodb_replset_member_health, mongodb_replset_member_uptime_seconds, mongodb_replset_optime_lag_seconds |
opLatencies | embedded in serverStatus | mongodb_op_latencies_latency_total, mongodb_op_latencies_ops_total |
profile | db.runCommand({profile: -1}) per database | mongodb_profiling_level |
Quick start (Docker Compose — full stack):
# Spins up MongoDB 8.0 + Exporter + Prometheus + Grafana in one command
git clone https://github.com/gurjarchetan/mongodb-exporter
cd mongodb-exporter
docker compose up -d
# Grafana → http://localhost:3000 (admin / admin)
Prometheus scrape config:
scrape_configs:
  - job_name: mongodb
    static_configs:
      - targets: ['mongodb-exporter:9216']
    scrape_interval: 15s
Enabling the slow query profiler (shows data in the Profiler row):
// MongoDB shell — enable slow op logging (>0 ms)
use admin
db.adminCommand({ profile: 1, slowms: 0 })
Requirements
- Prometheus (any modern version)
- MongoDB 6.0, 7.0, or 8.0 (standalone or replica set)
- mongodb-exporter running and scraped by Prometheus
The datasource variable DS_PROMETHEUS maps to your Prometheus instance — set it when importing.
Data source config
Collector config:
Upload an updated version of an exported dashboard.json file from Grafana
| Revision | Description | Created | |
|---|---|---|---|
| Download |

MongoDB

Easily monitor MongoDB, a general purpose, document-based, distributed database, with Grafana Cloud's out-of-the-box monitoring solution.
Learn more