
Veeam Kasten Red Hat ACM Multi-Cluster Observability
Veeam Kasten Kubernetes protection observability dashboard for Red Hat Advanced Cluster Management (ACM) with Multi-Cluster Observability (MCO).
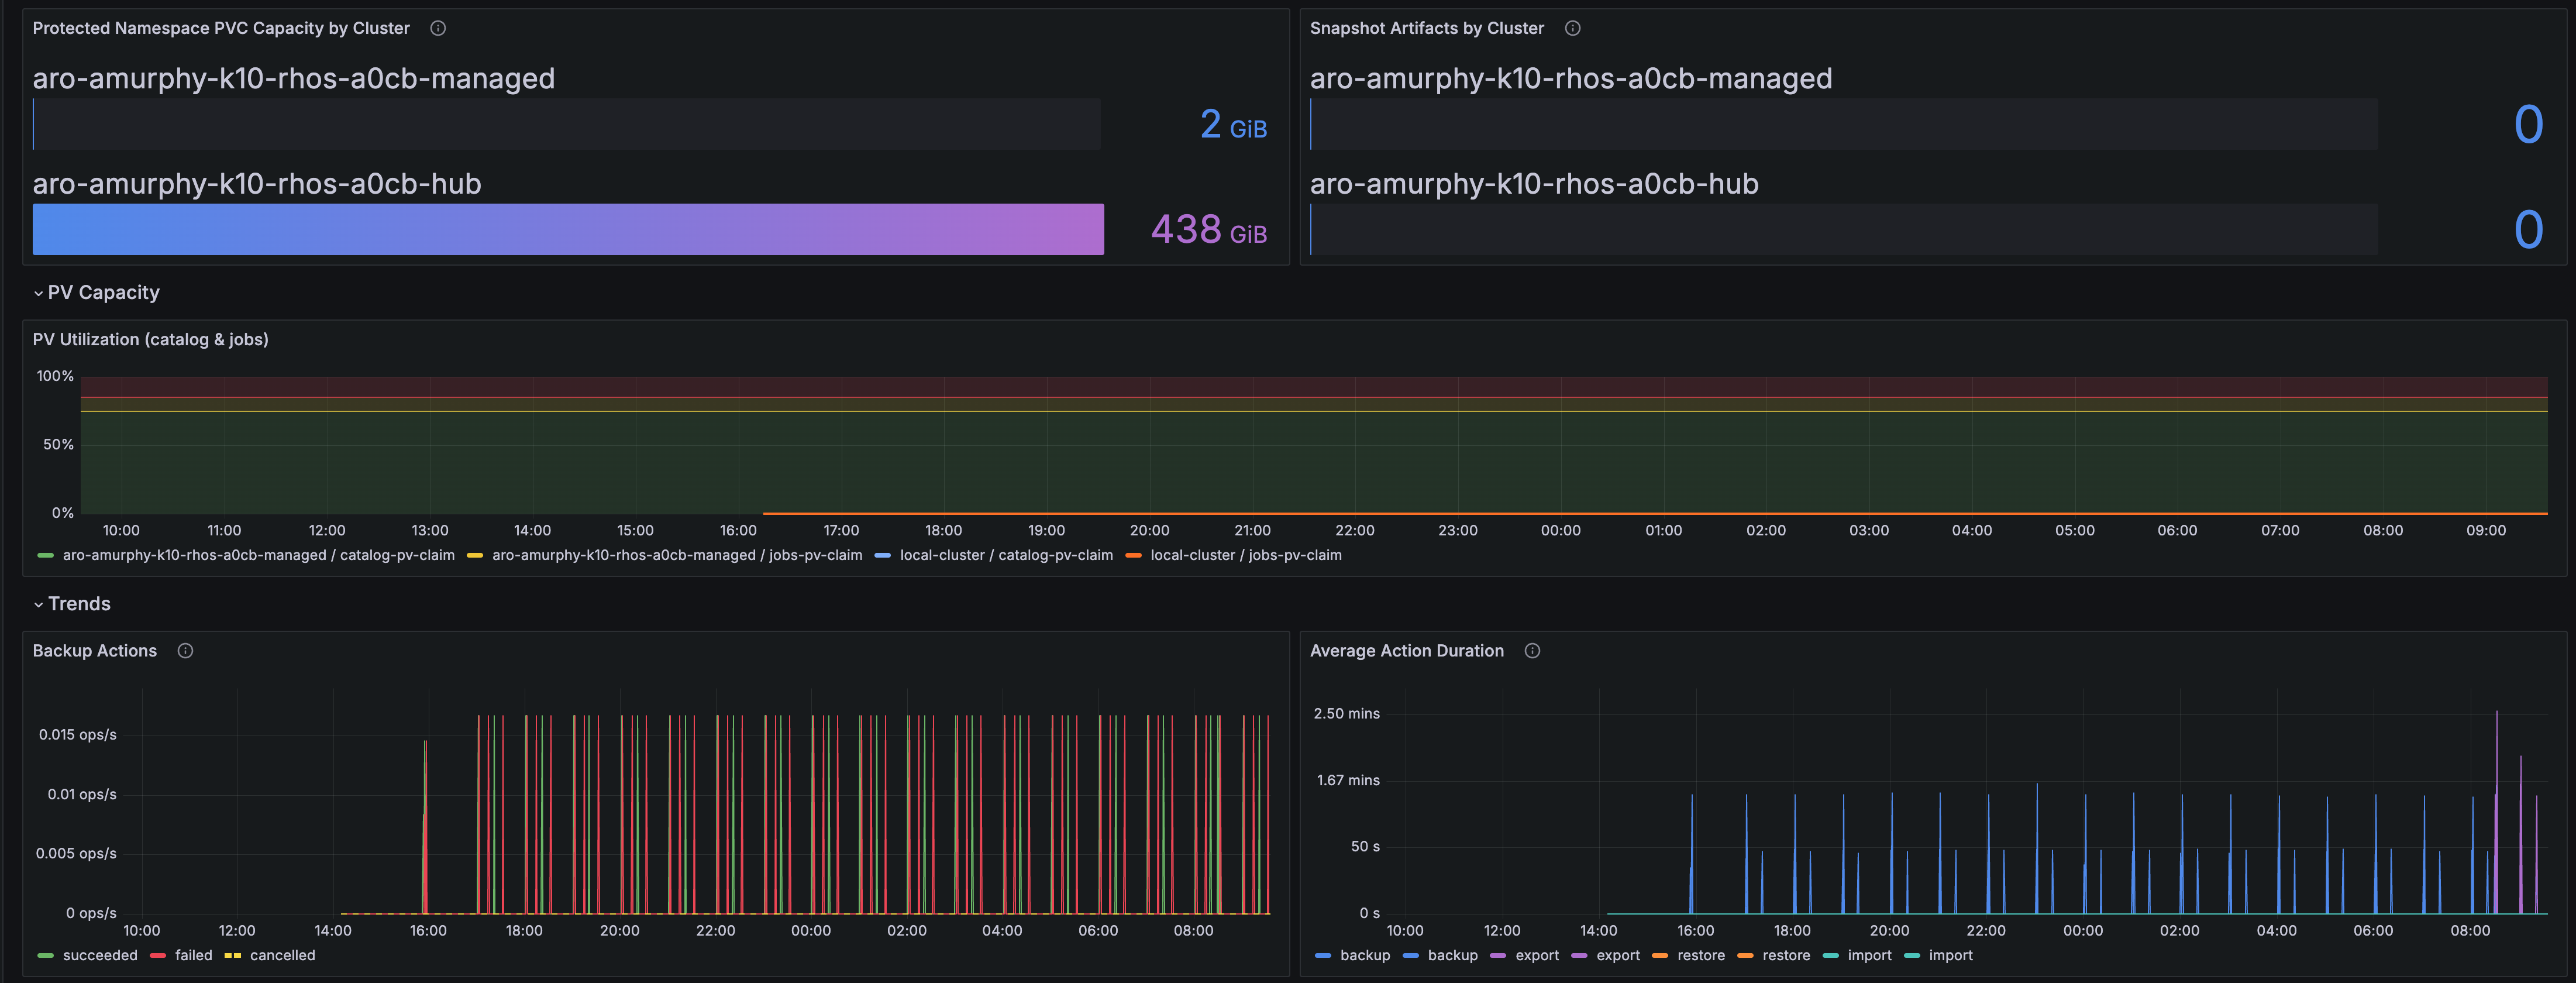
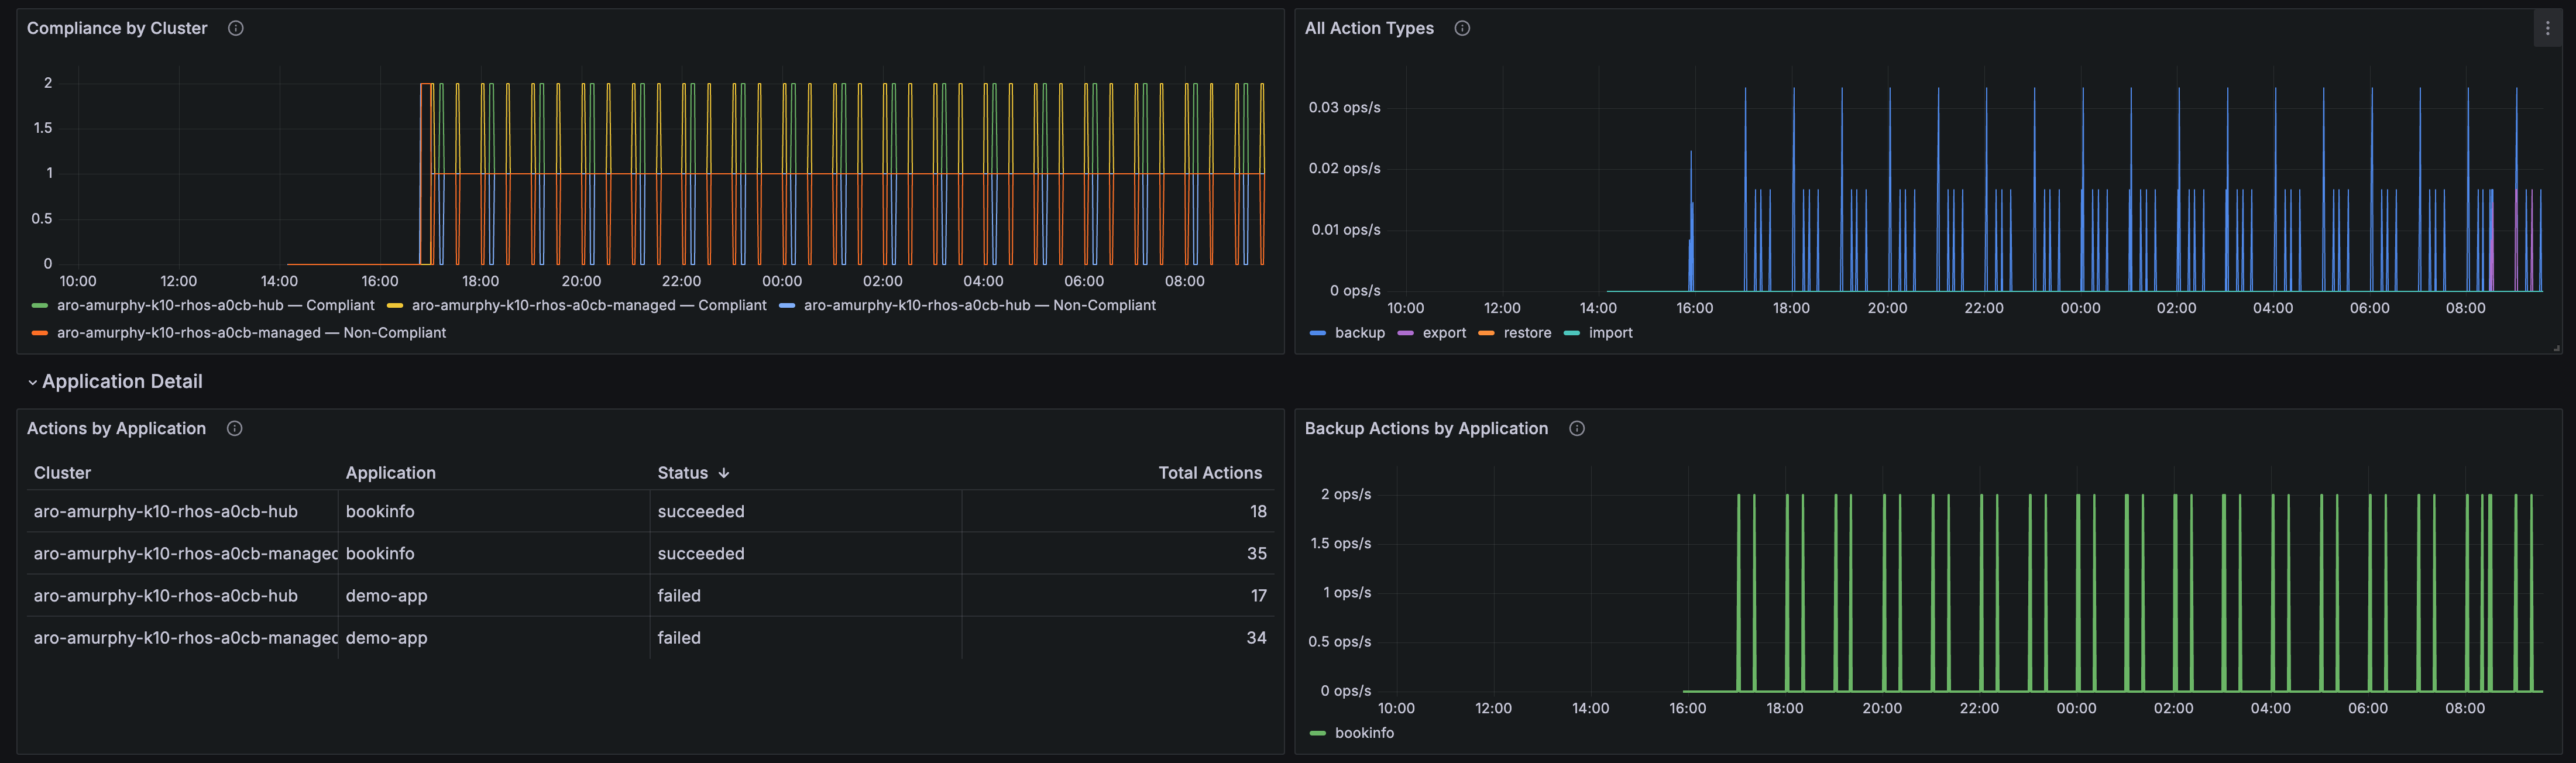
This dashboard delivers a unified view of Veeam Kasten backup status and protection health across all clusters managed by Red Hat Advanced Cluster Management (RHACM) with Multi-Cluster Observability (MCO). It is accessible via the Grafana instance which ships with Red Hat ACM.
Kasten metrics flow from each managed cluster via Prometheus remote_write to the MCO Thanos receive endpoint. The dashboard queries Thanos and surfaces them in the ACM Observe → Dashboards → General folder, with variable filters for cluster, policy, and application.
What this dashboard shows:
- Backup job history — completed, failed, and skipped action counts over time, per cluster
- Restore point inventory — local snapshot and export restore point counts by cluster
- Policy compliance — backup success/failure rates by policy name and application
- Storage utilization — local snapshot storage usage and PVC capacity consumed by Kasten workloads
Data source: Prometheus / Thanos (MCO hub)
Deployment method: ConfigMap injection into ACM MCO Grafana (label grafana-custom-dashboard: "true" on the ConfigMap in the open-cluster-management-observability namespace). No direct Grafana API access required.
Prerequisites:
- RHACM hub cluster with MCO deployed
- Managed clusters running Kasten with
remote_writeconfigured to MCO Thanos (port 19291) - Kubelet PV metrics added to the ACM observability allowlist (
kubelet_volume_stats_used_bytes,kubelet_volume_stats_capacity_bytes) - OpenShift CLI (
oc) with access to the hub cluster
See the Kasten documentation for details on configuring remote_write for Red Hat ACM and for details on deploying this dashboard via an OpenShift configmap.
Data source config
Collector config:
Upload an updated version of an exported dashboard.json file from Grafana
| Revision | Description | Created | |
|---|---|---|---|
| Download |