Grafana + Snap
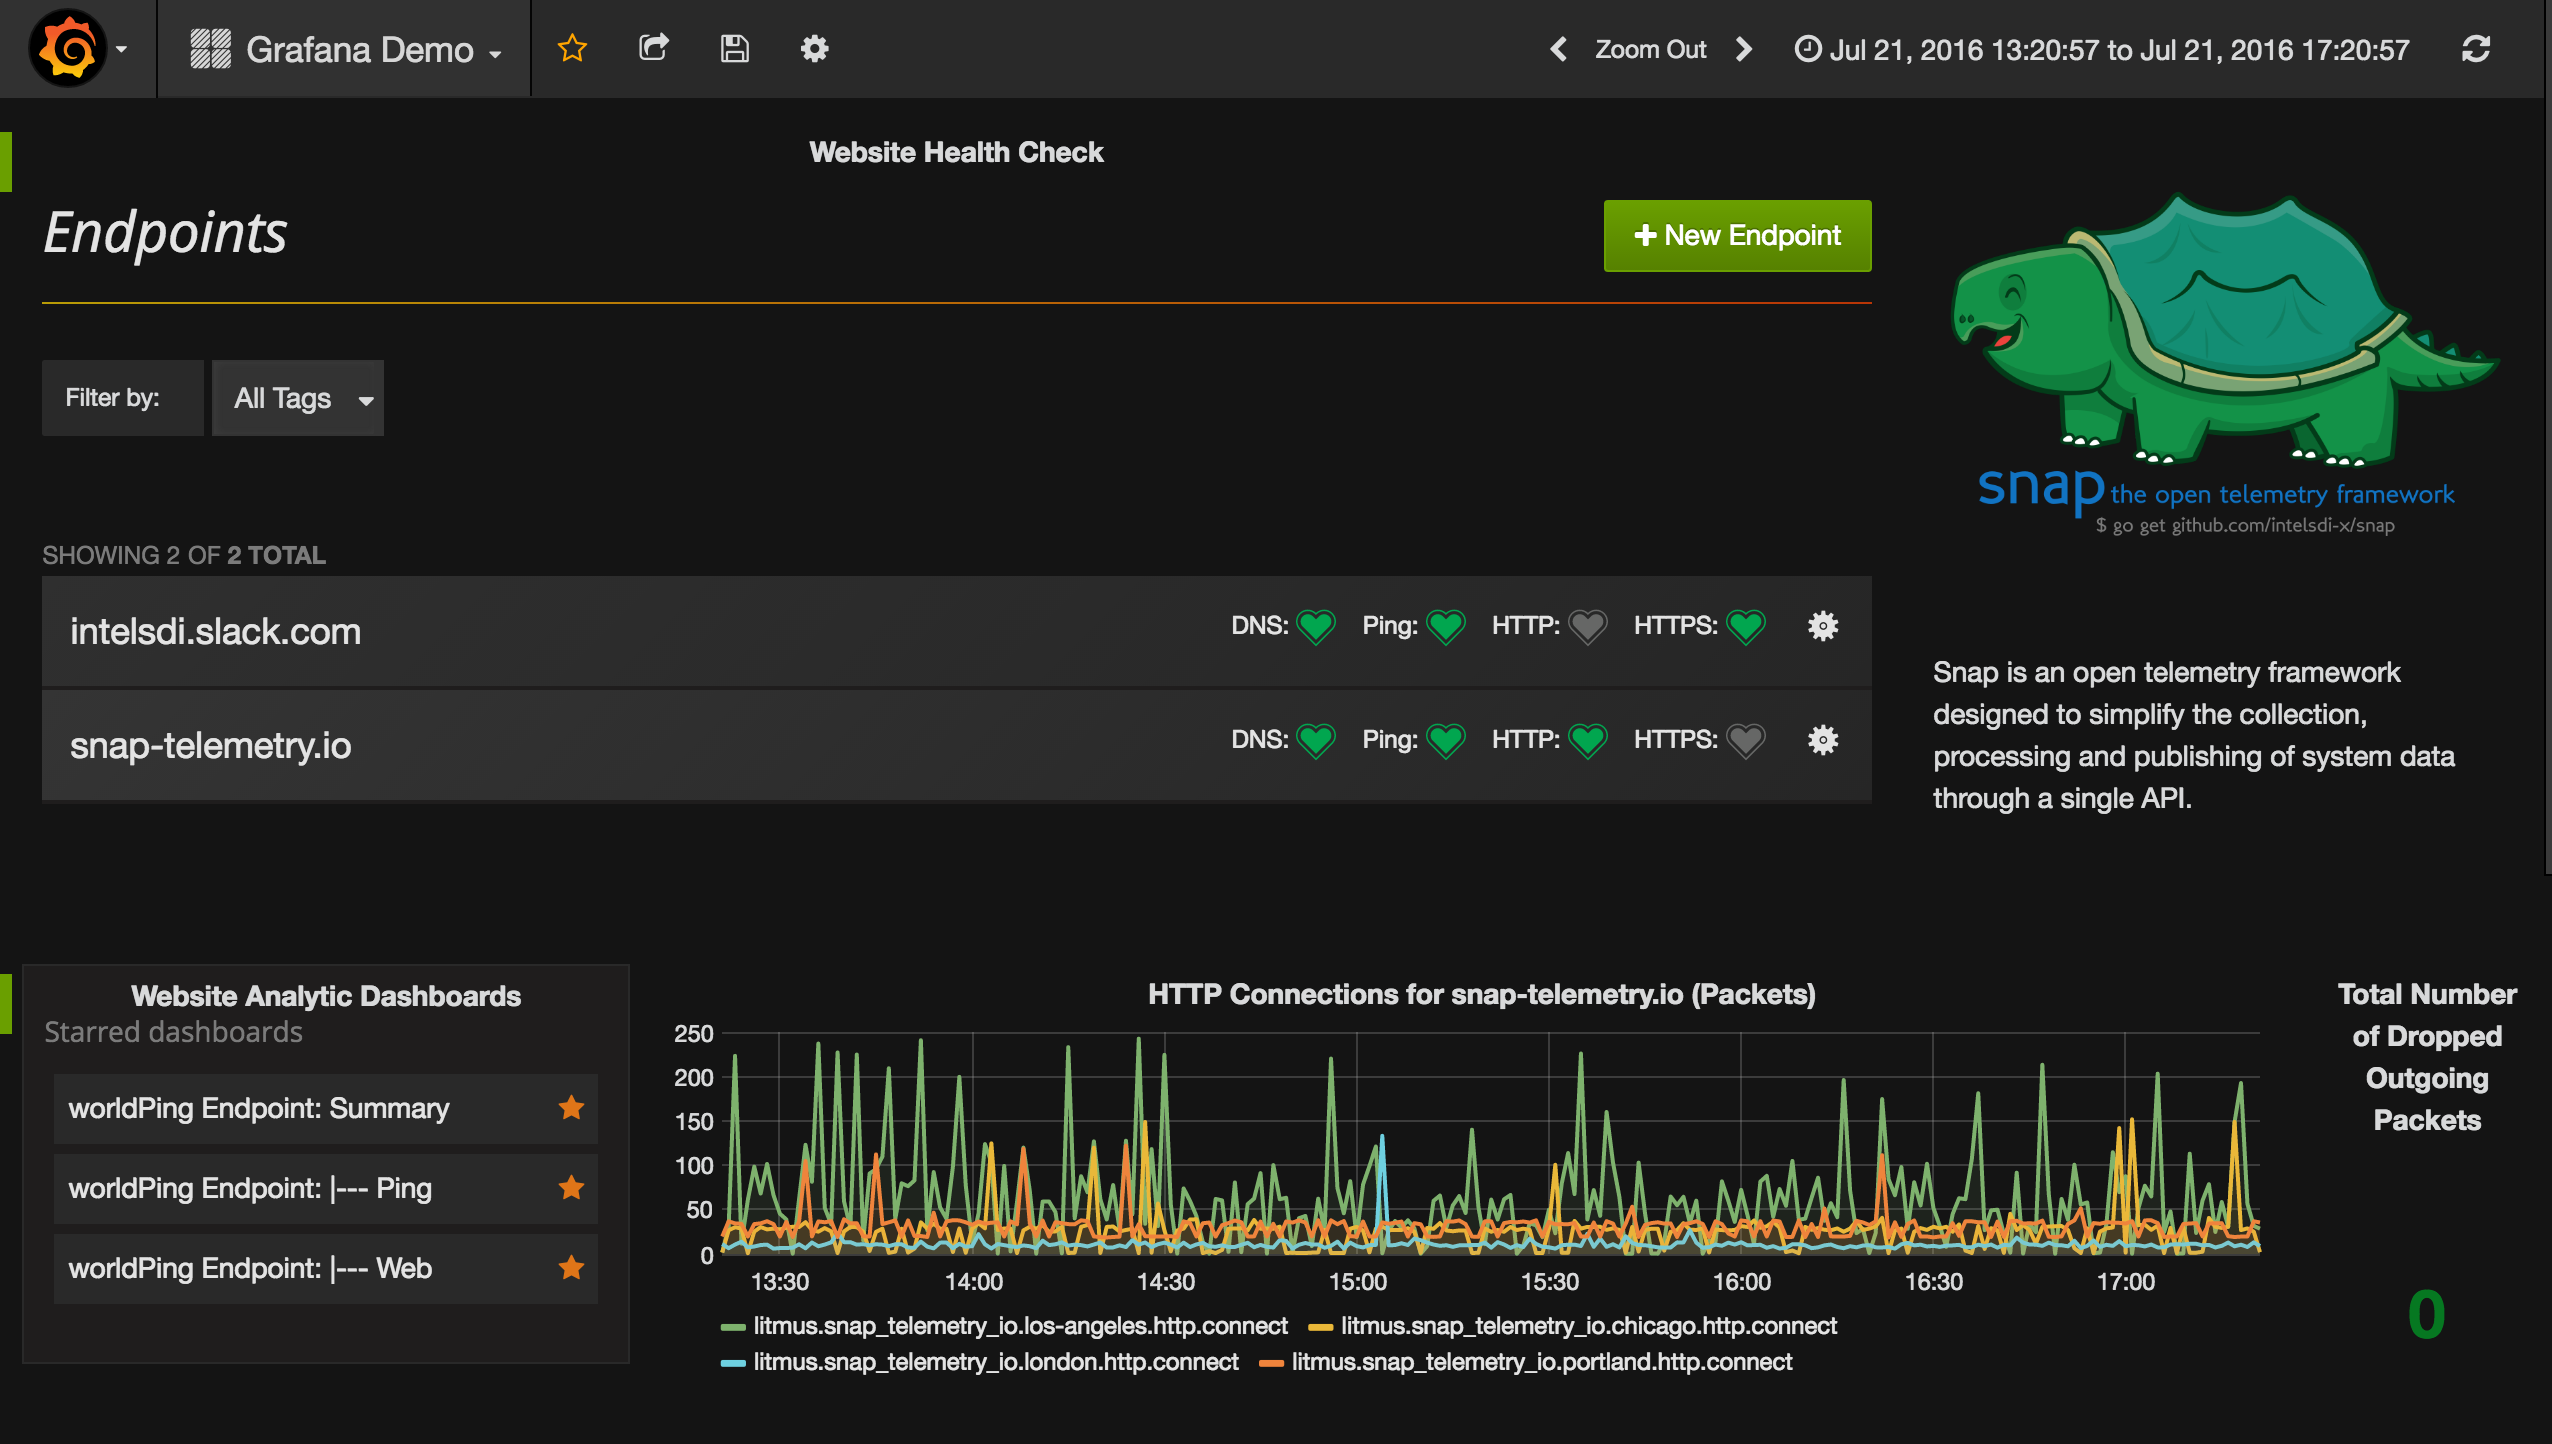
Utilizes Snap to collect telemetry from personal computer and selected websites (intelsdi.slack.com and snap-telemetry.io).
Snap is an open telemetry framework designed to simplify the collection, processing and publishing of system data through a single API. The goals of this project are to:
- Empower systems to expose a consistent set of telemetry data
- Simplify telemetry ingestion across ubiquitous storage systems
- Improve the deployment model, packaging and flexibility for collecting telemetry
- Allow flexible processing of telemetry data on agent (e.g. filtering and decoration)
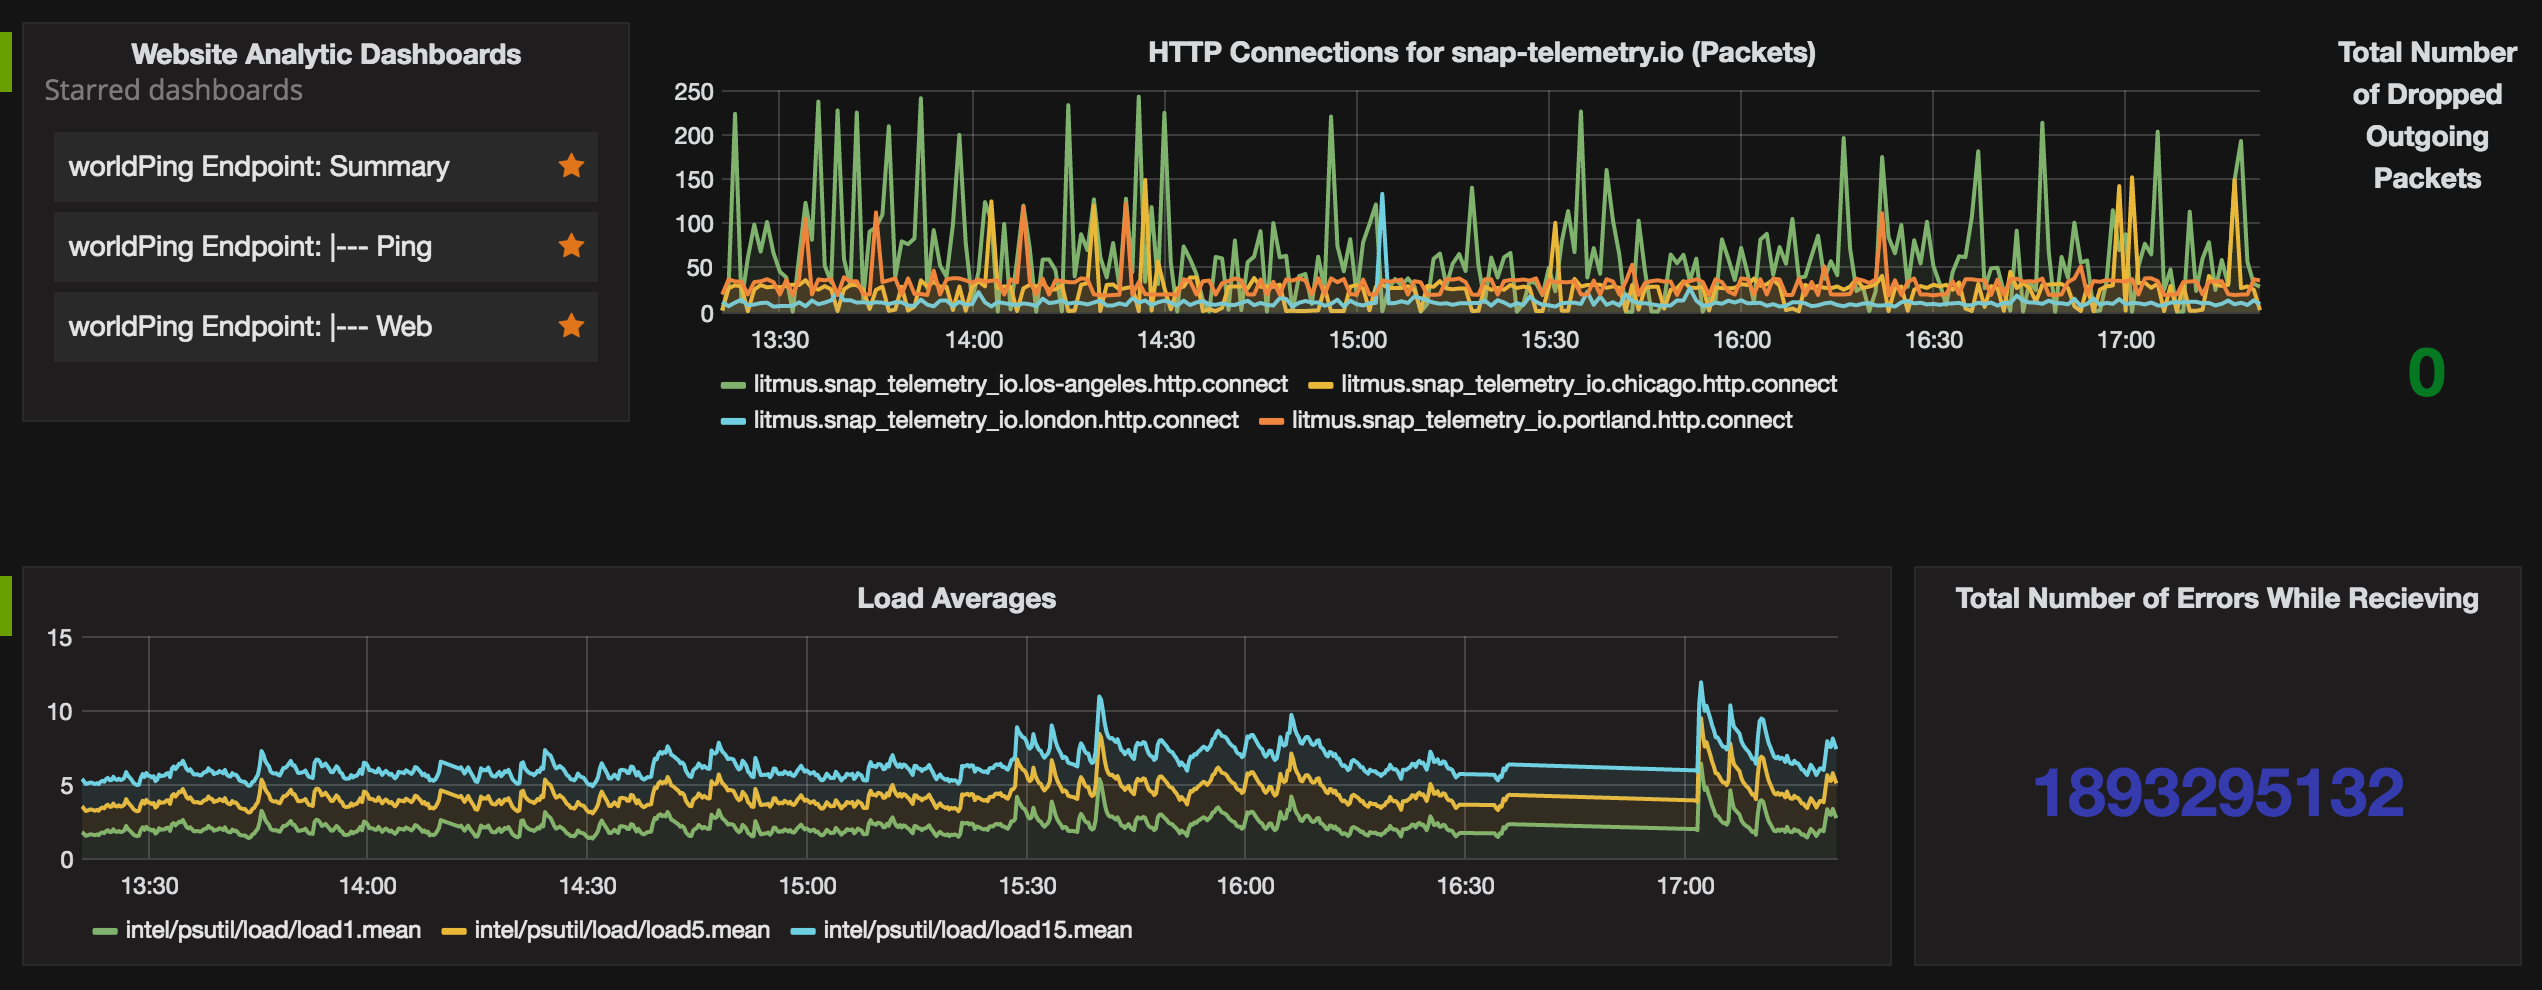
This dashboard will utilize Snap to gather telemetry surrounding computer performance and status of http://snap-telemetry.io and intelsdi.slack.com. Visit these sites, as well as github.com/intelsdi/snap, to learn more.
Find the Snap task here: https://github.com/NichelleBot/Snap-Grafana
Data source config
Collector config:
Upload an updated version of an exported dashboard.json file from Grafana
| Revision | Description | Created | |
|---|---|---|---|
| Download |

