SFTPGo Enterprise
Monitor SFTPGo Enterprise file transfer activity, per-user metrics, authentication, storage backend operations, and process health via Prometheus.
SFTPGo Enterprise - Grafana Dashboard
Official Grafana dashboard for monitoring SFTPGo Enterprise via Prometheus.
Panels
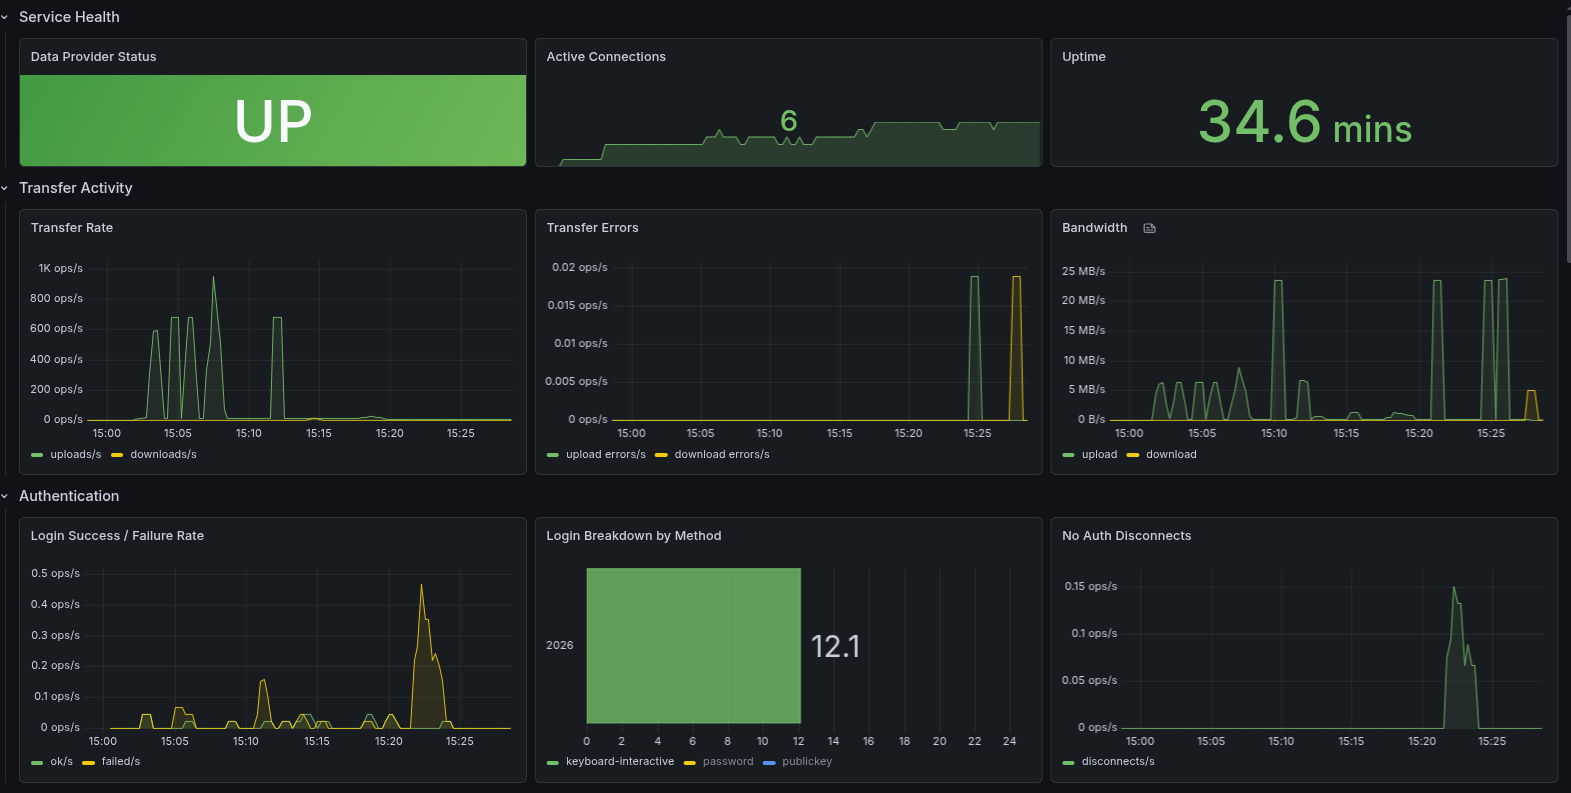
- Service Health — data provider status, active connections, uptime
- Transfer Activity — upload/download rates, bandwidth, errors
- Authentication — login success/failure rates by method
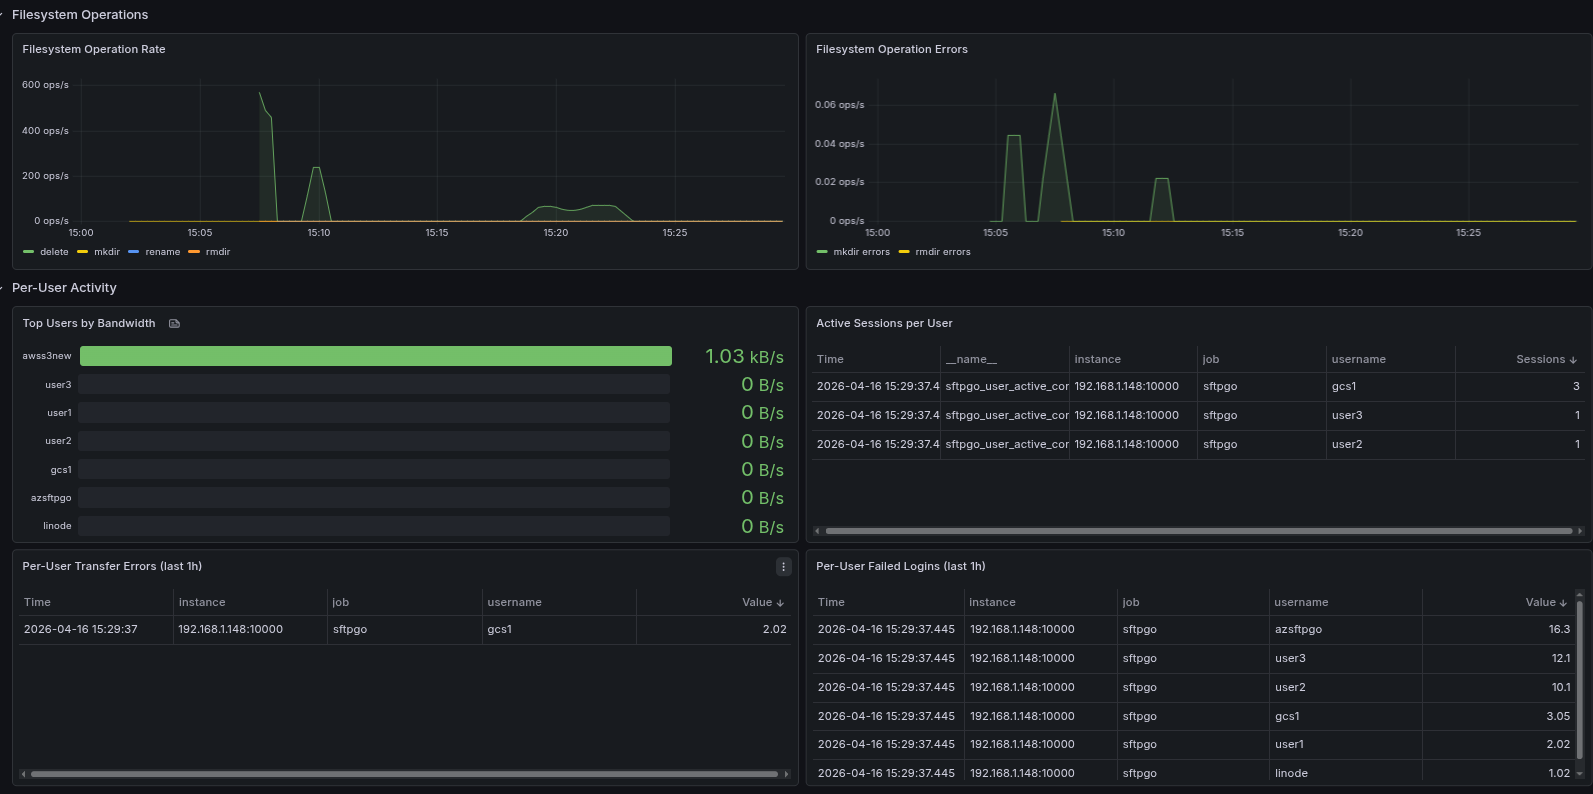
- Filesystem Operations — rename, delete, copy, mkdir rates
- Per-User Activity — top users by bandwidth, sessions, errors, failed logins
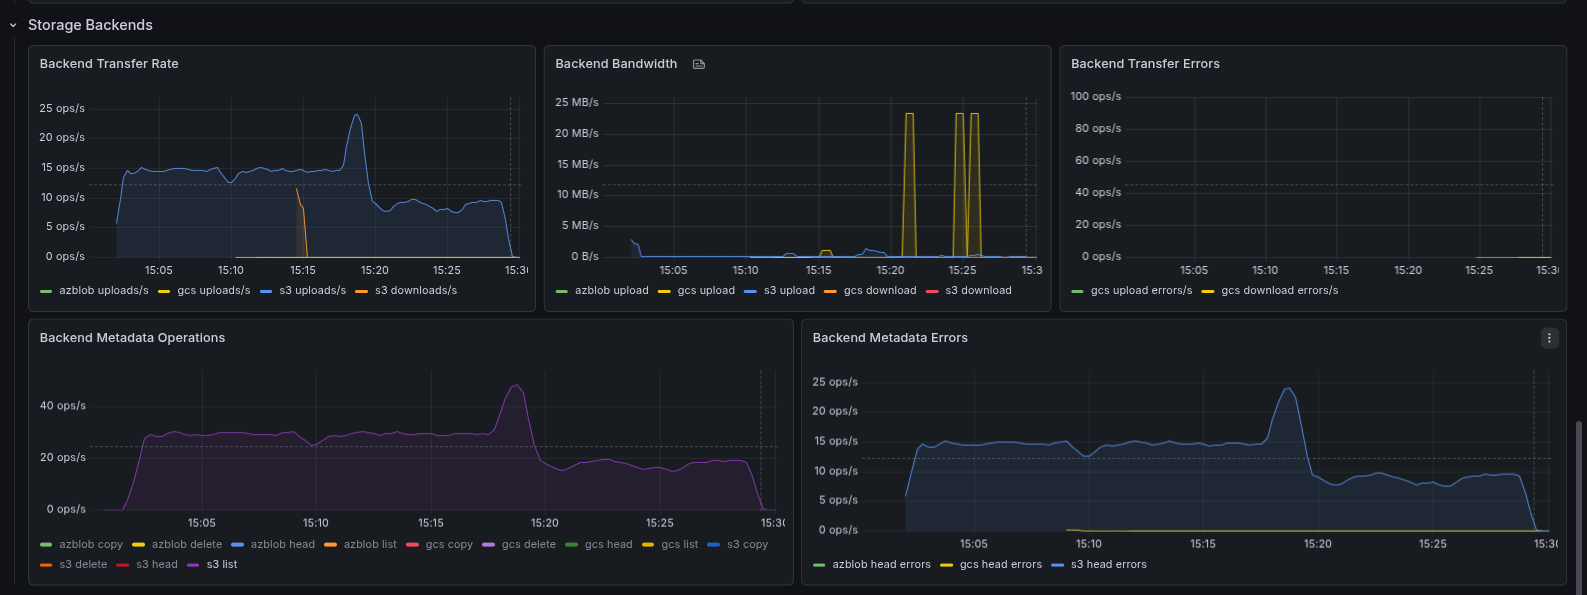
- Storage Backends — per-backend transfers, bandwidth, metadata ops (S3, GCS, Azure Blob)
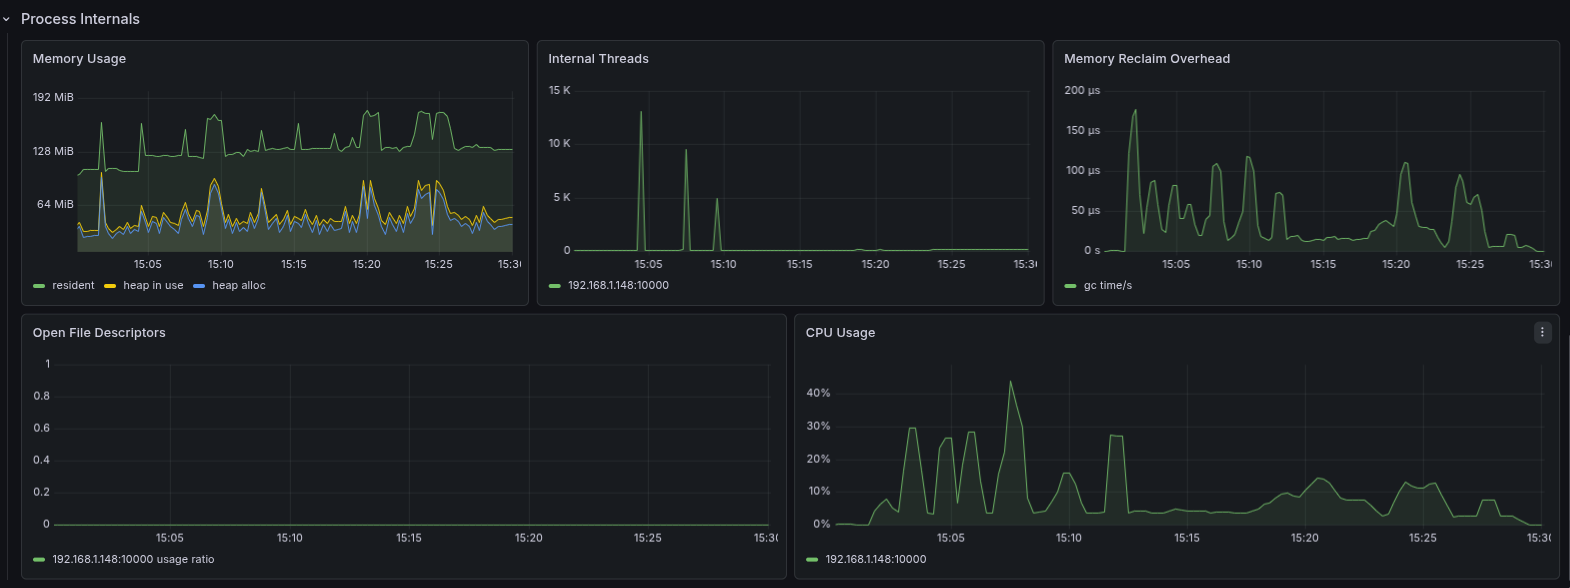
- Process Internals — memory, CPU, file descriptors
See the SFTPGo metrics documentation for the full metric reference.
Data source config
Collector type:
Collector plugins:
Collector config:
Revisions
Upload an updated version of an exported dashboard.json file from Grafana
| Revision | Description | Created | |
|---|---|---|---|
| Download |
Cilium Enterprise
Easily monitor your deployment of Cilium Enterprise with Grafana Cloud's out-of-the-box monitoring solution.
Learn more