Uptime Monitor
Monitor dashboard for Uptime Kuma / Prometheus metrics with domain-level filtering
Uptime Monitor
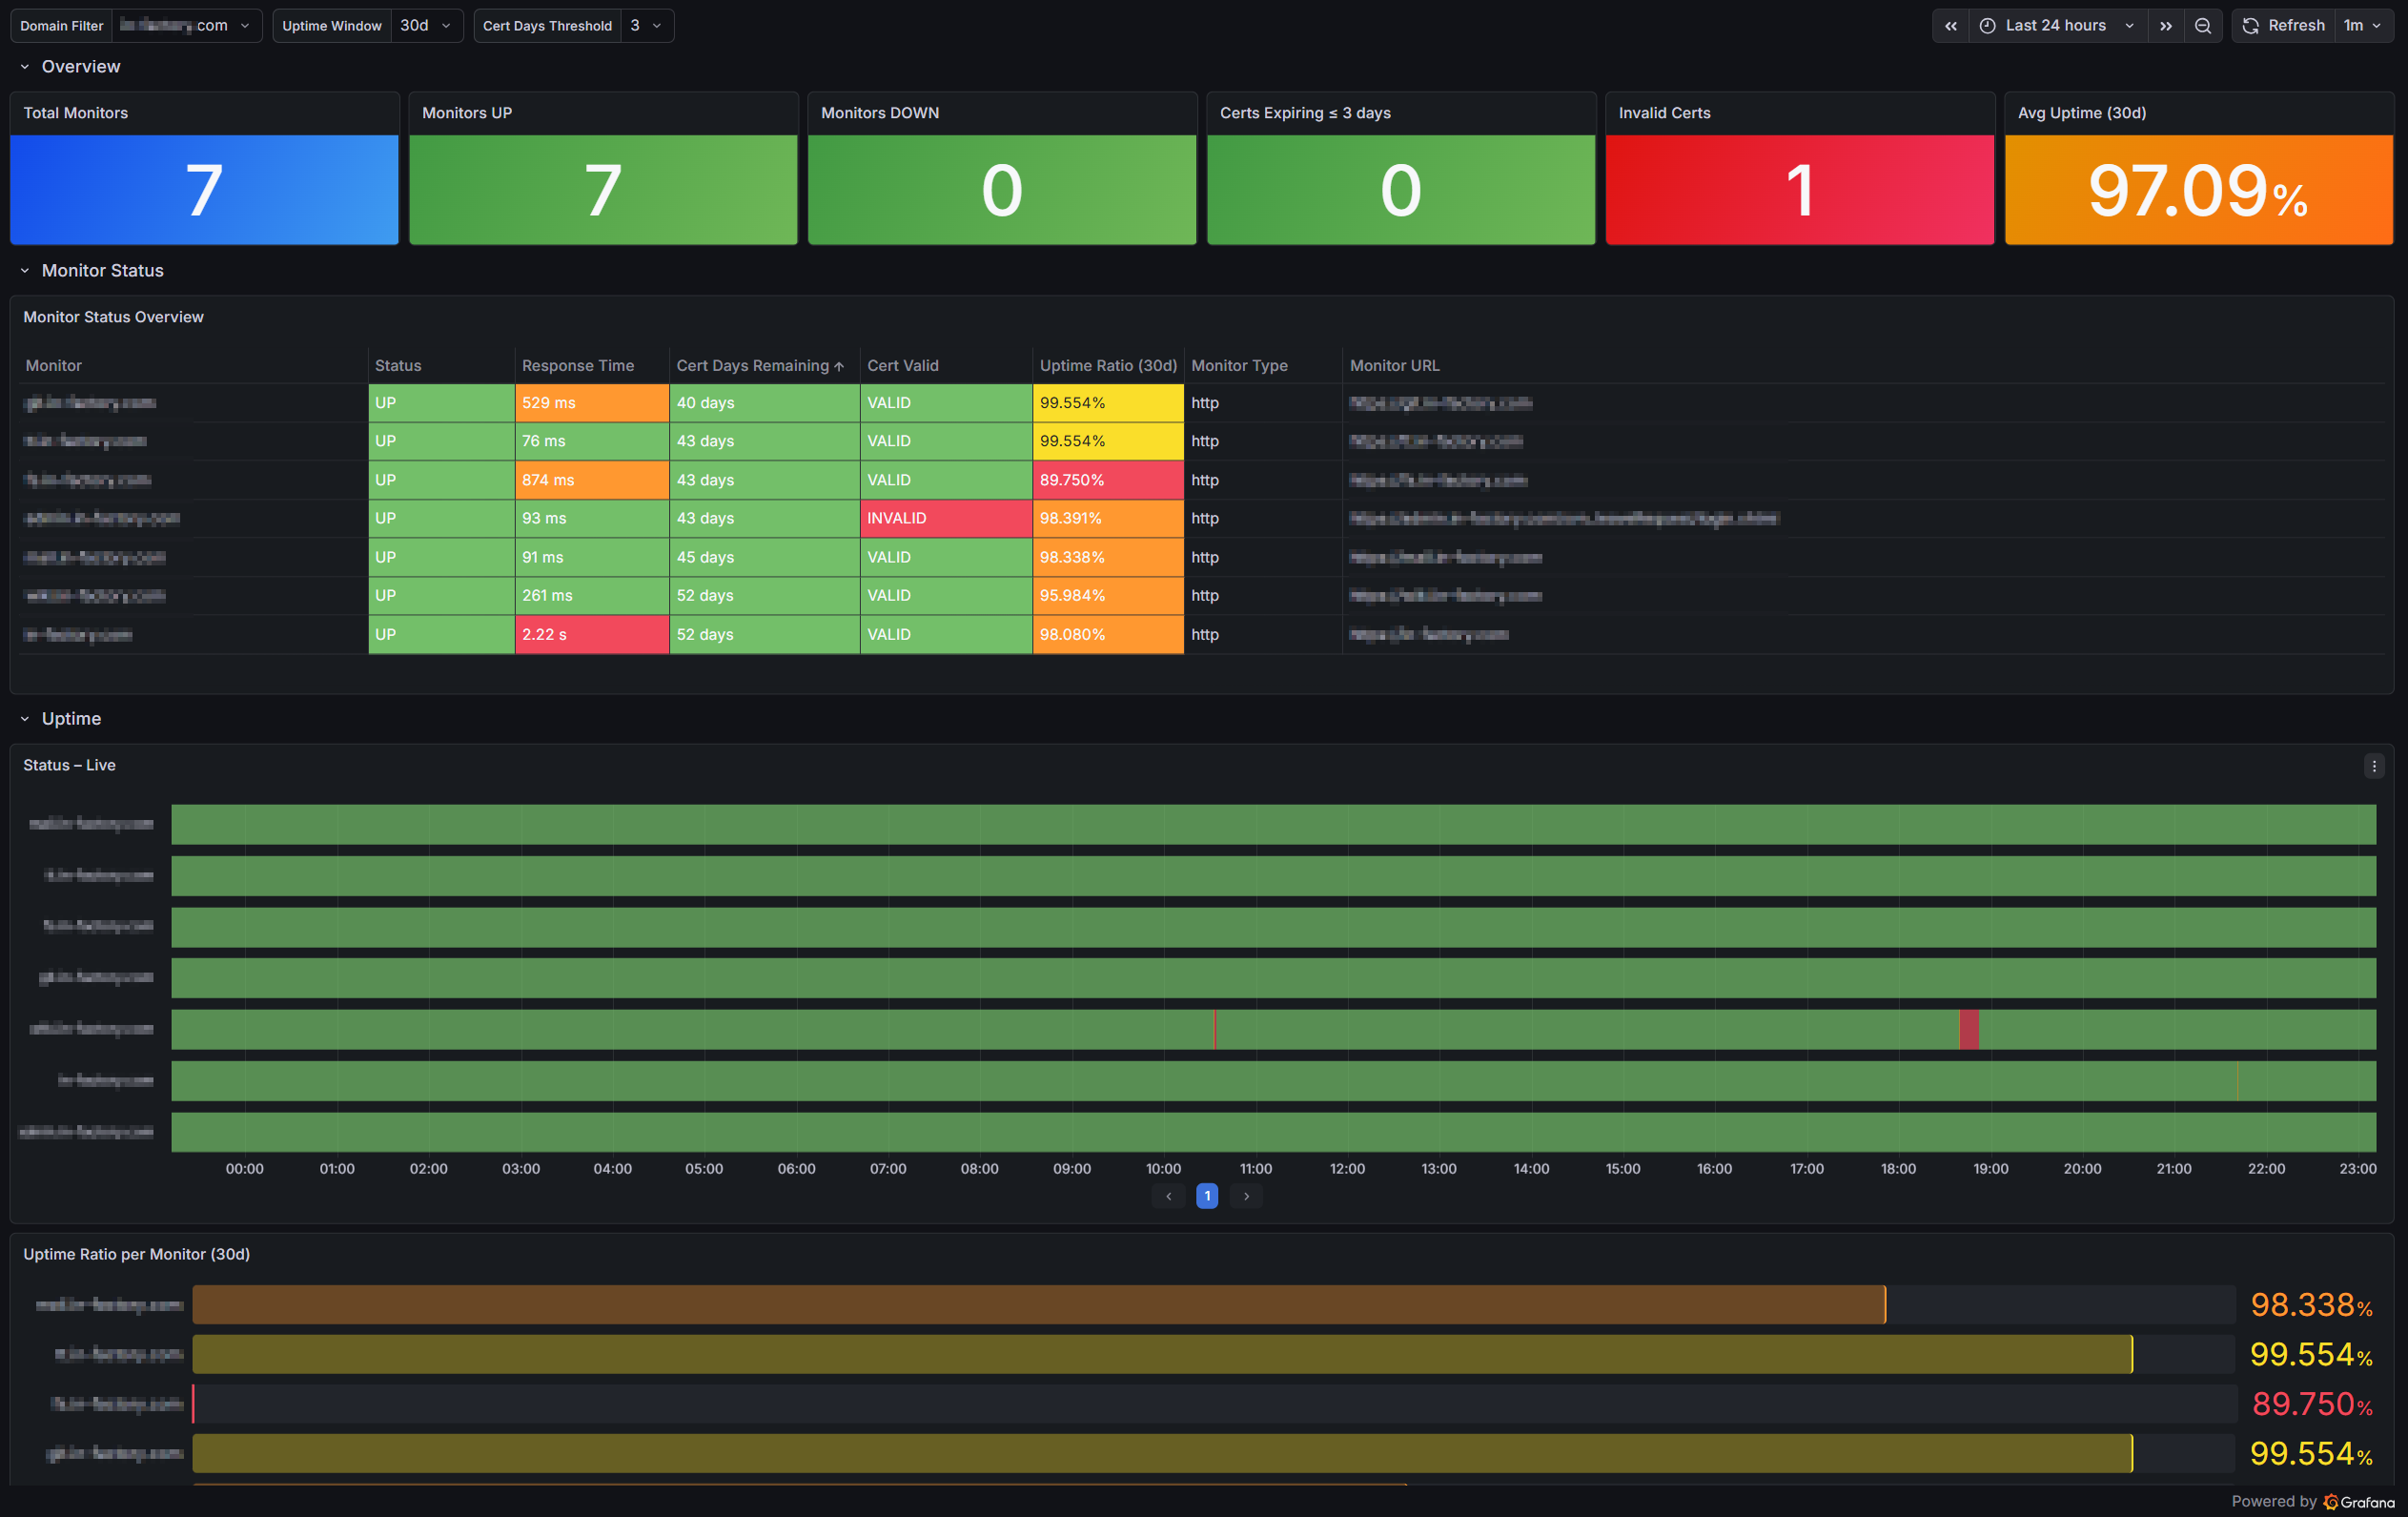
Grafana dashboard for Uptime Kuma with Prometheus/Mimir — providing a real-time overview of monitor health, response times, SSL certificates, and uptime ratios with domain-level filtering.
Features
- Overview stat bar — Total, UP, DOWN, Certs Expiring, Invalid Certs, Avg Uptime
- Monitor Status Table — one row per monitor with Status, Response Time, Cert Days Remaining, Cert Valid, and Uptime Ratio columns; sorted by most urgent certificate first
- Status Timeline — colour-coded UP/DOWN/PENDING/MAINTENANCE history per monitor
- Response Time — live time series and per-monitor bar gauge
- Uptime — bar gauge and historical time series per monitor
- SSL Certificates — days remaining and validity bar gauges
- Monitor Groups — uptime and response time for Uptime Kuma group monitors
Variables
| Variable | Description | Default |
|---|---|---|
domain_filter | Filter by domain (dynamically fetched via label_values) | All |
uptime_window | Uptime/response time window: 1d, 30d, 365d | 30d |
threshold_cert_days | Cert expiry warning threshold in days | 3 |
Requirements
- Uptime Kuma with Prometheus endpoint enabled
- Mimir or Prometheus scraping Uptime Kuma
Data source config
Collector type:
Collector plugins:
Collector config:
Revisions
Upload an updated version of an exported dashboard.json file from Grafana
| Revision | Description | Created | |
|---|---|---|---|
| Download |