
Bambulab Metrics
Real-time monitoring dashboard for BambuLab 3D printers. Tracks printer health, print progress, temperatures, fan speeds, AMS filament inventory, and queue status via Prometheus metrics. Supports multiple printers and AMS units automatically.
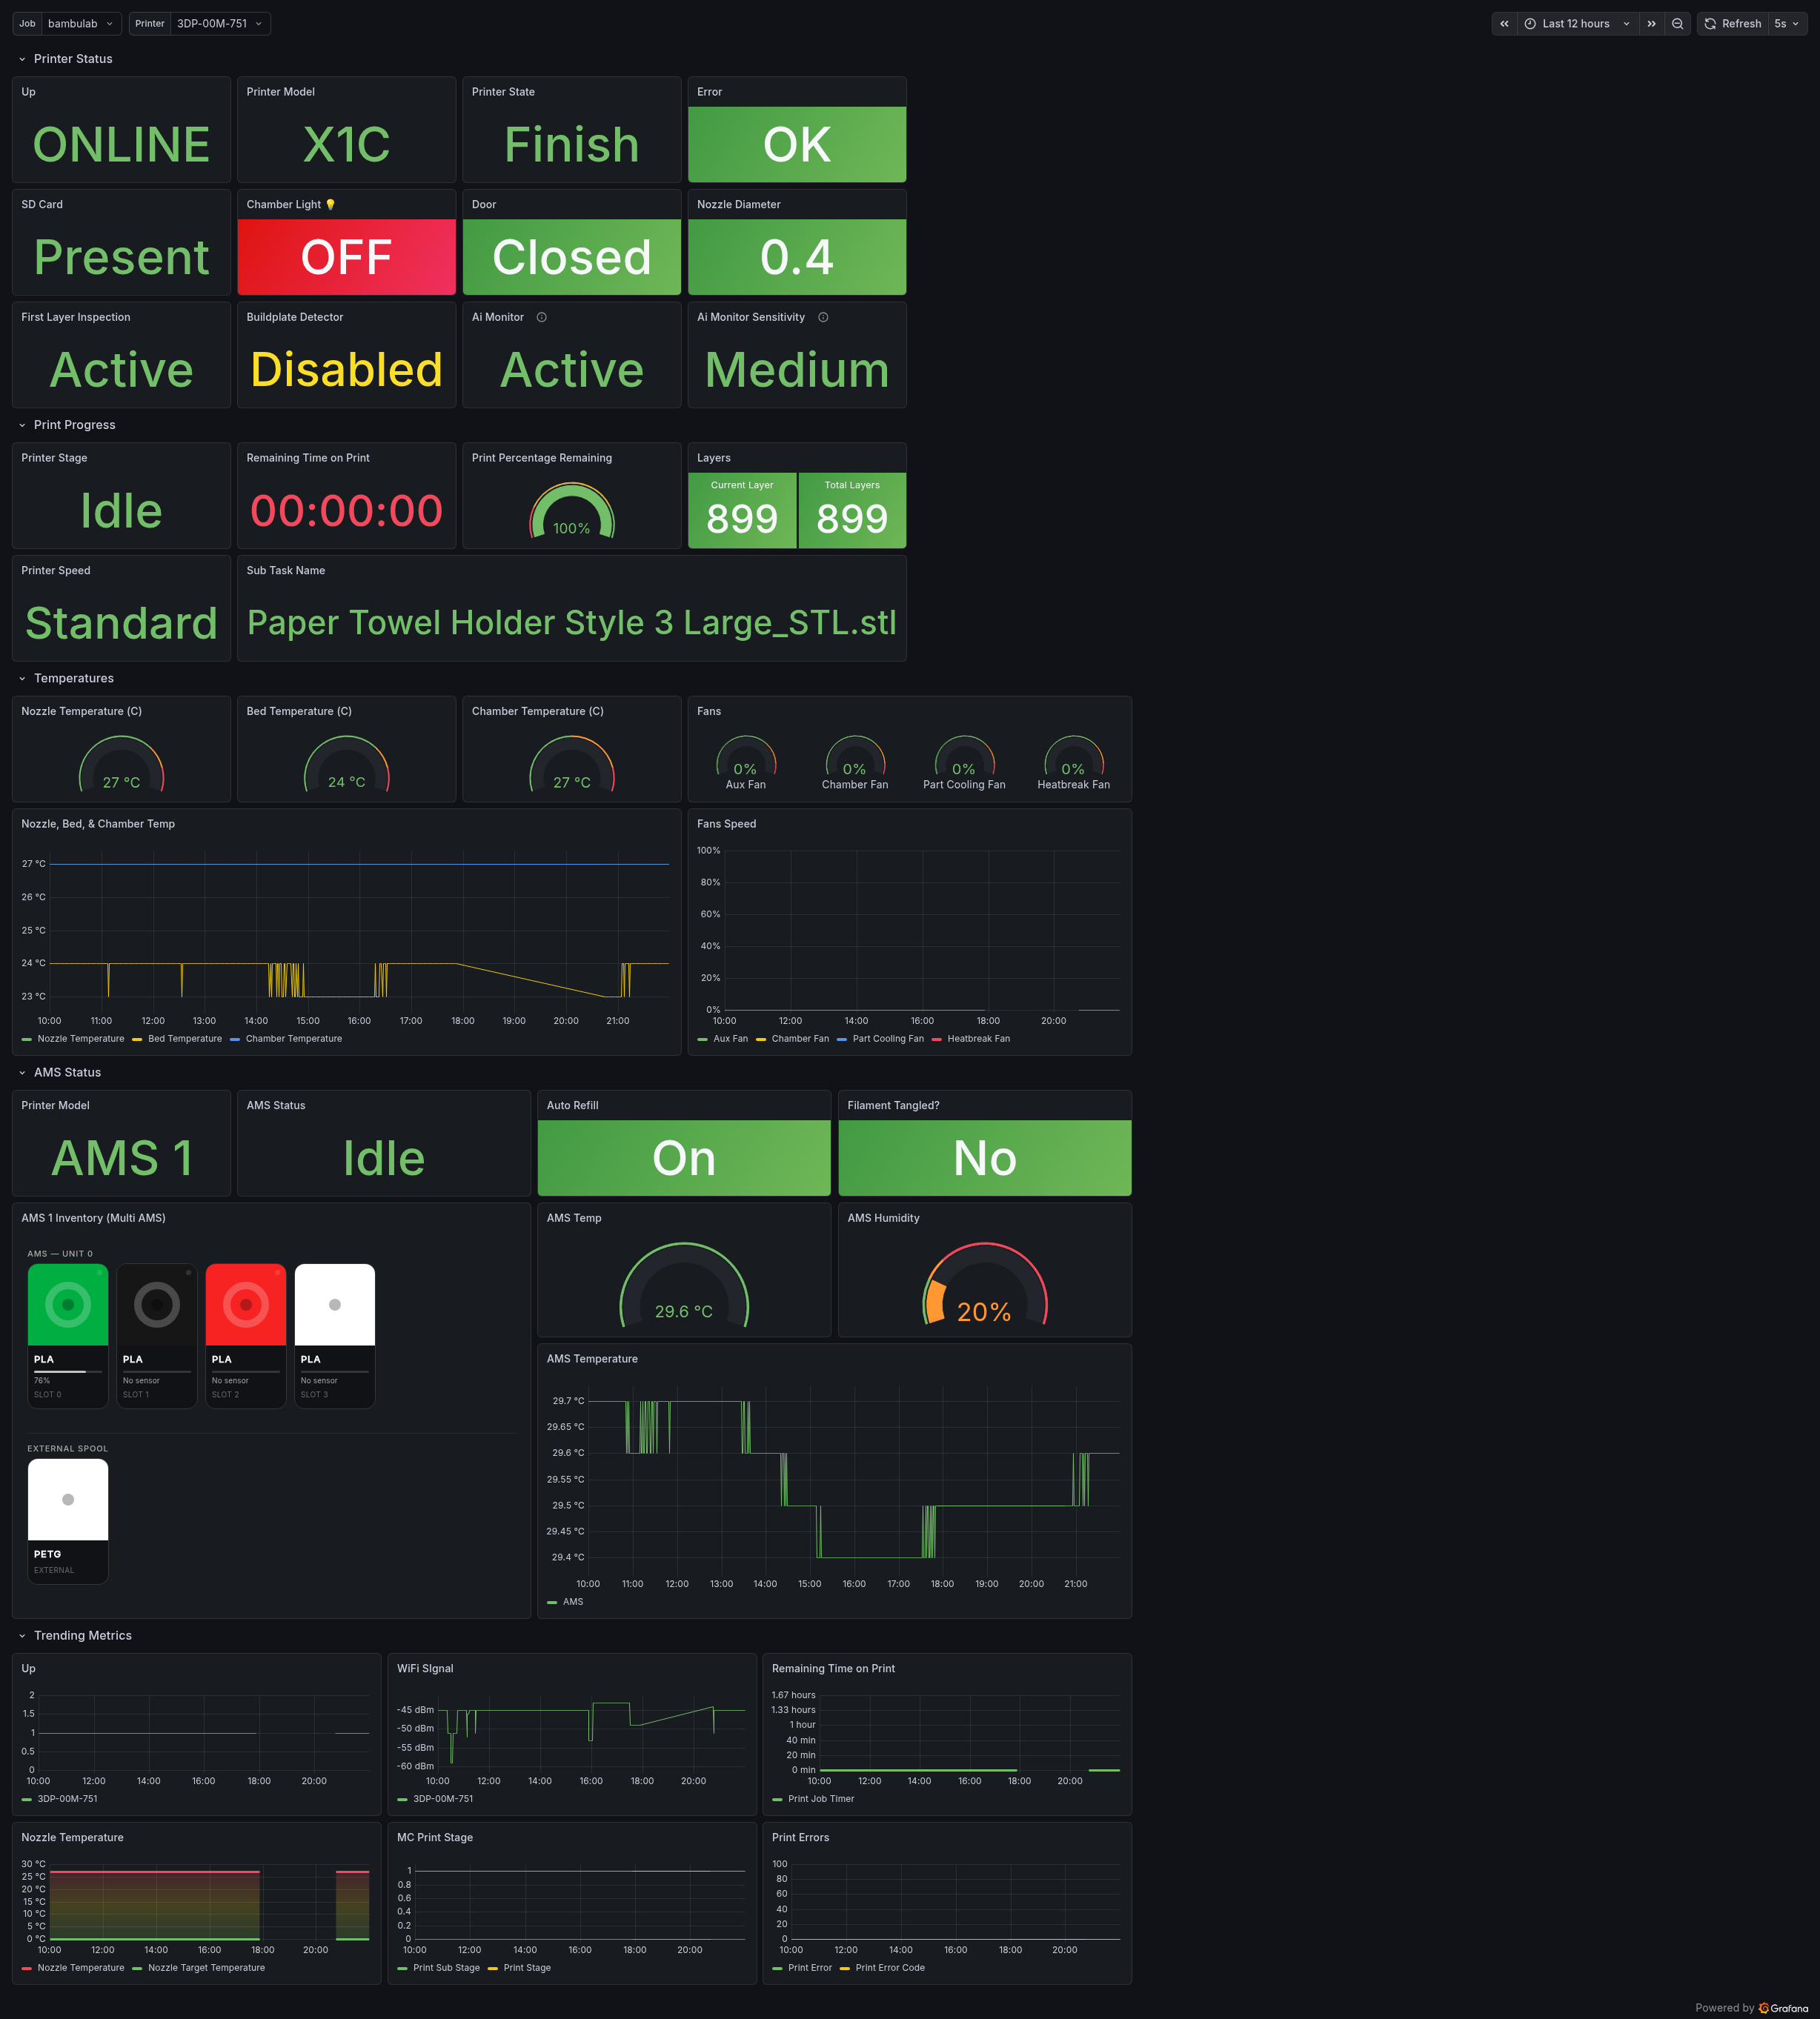
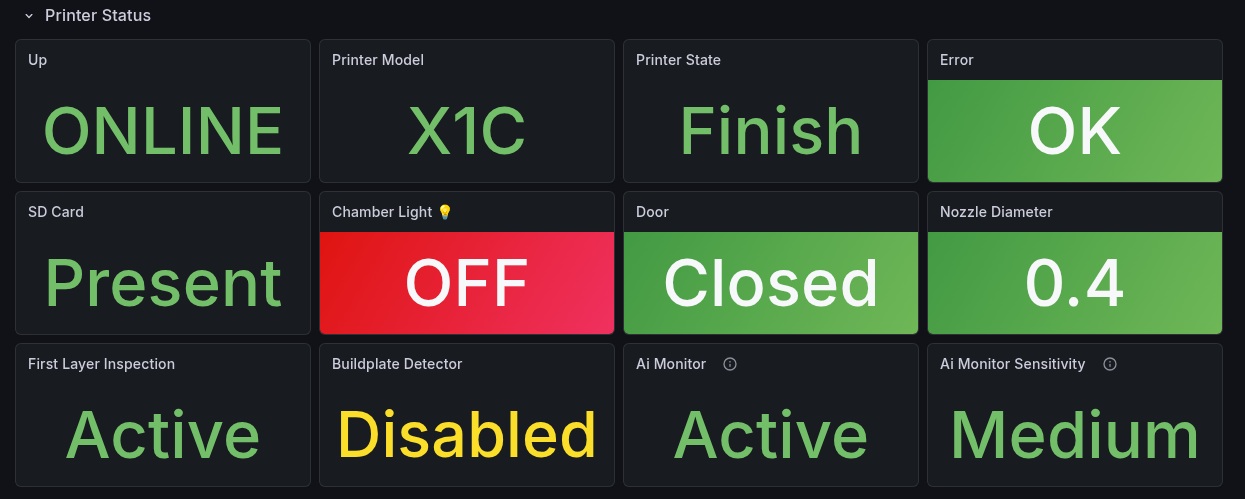
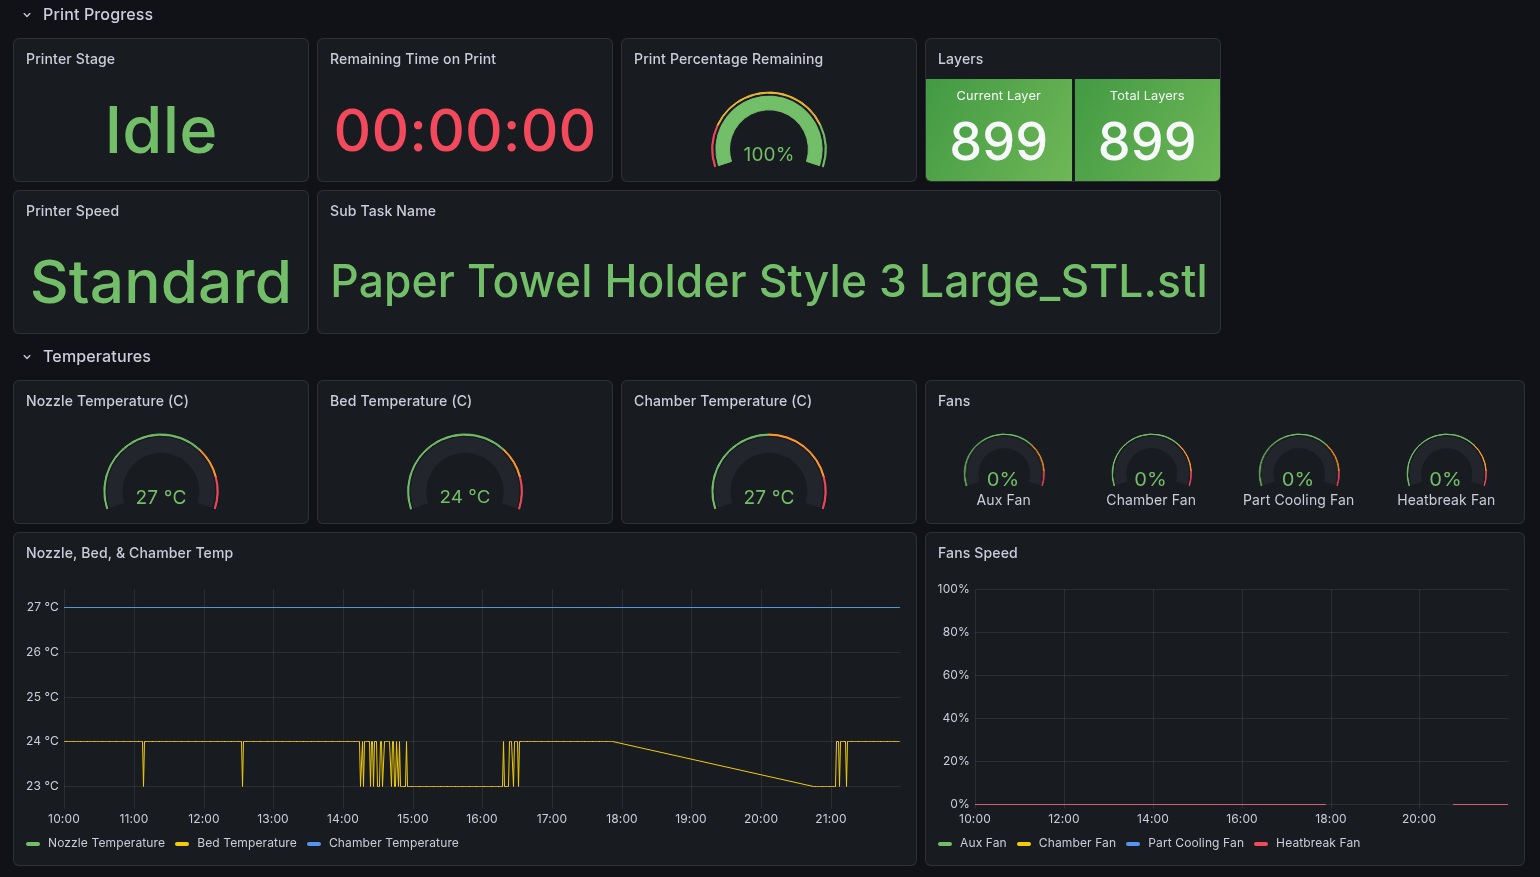
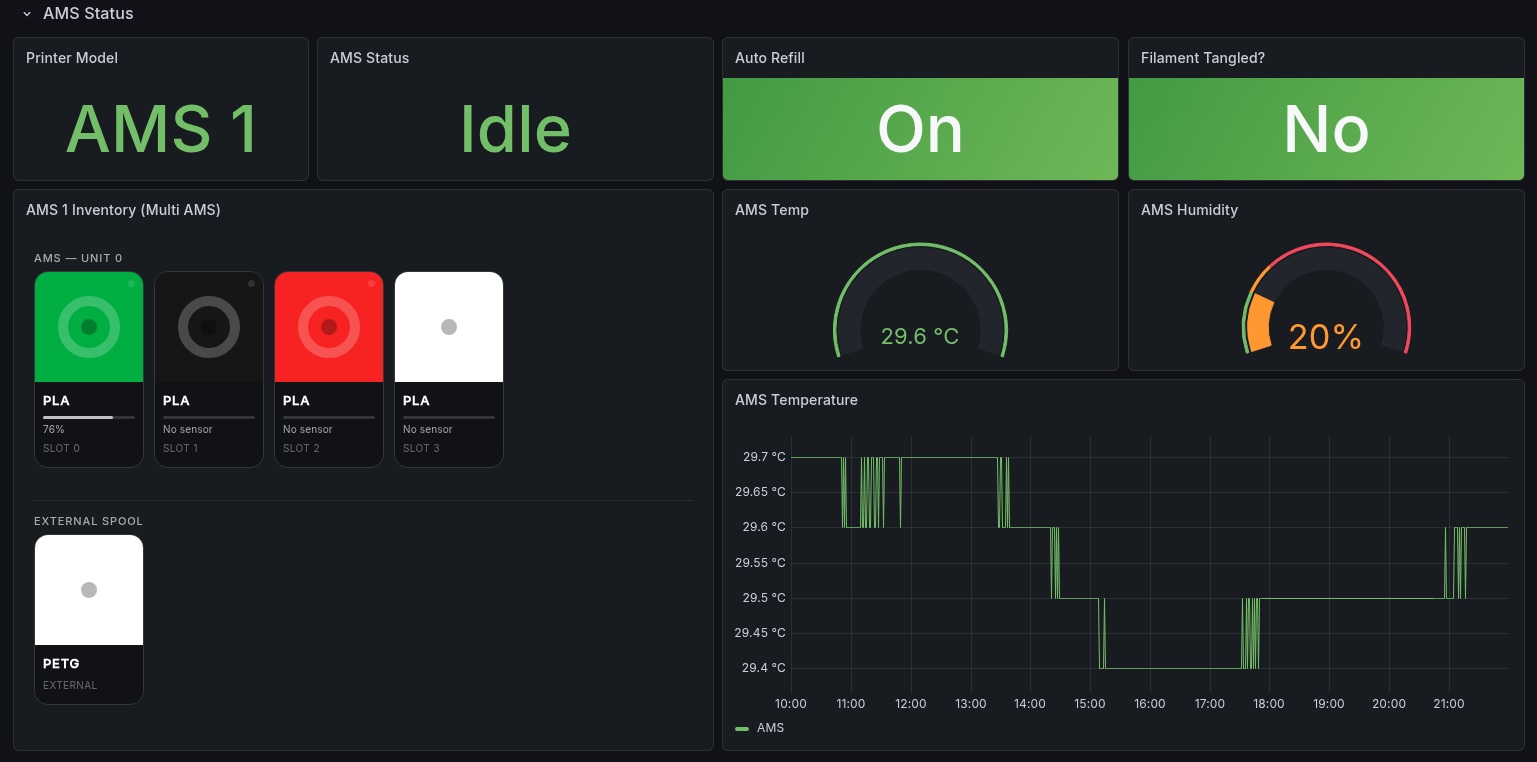
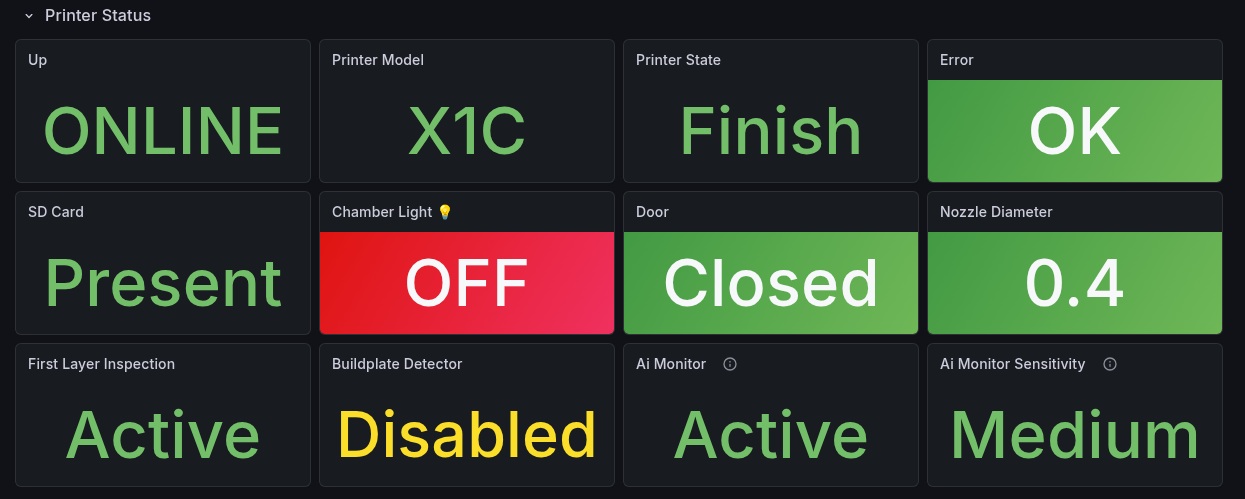
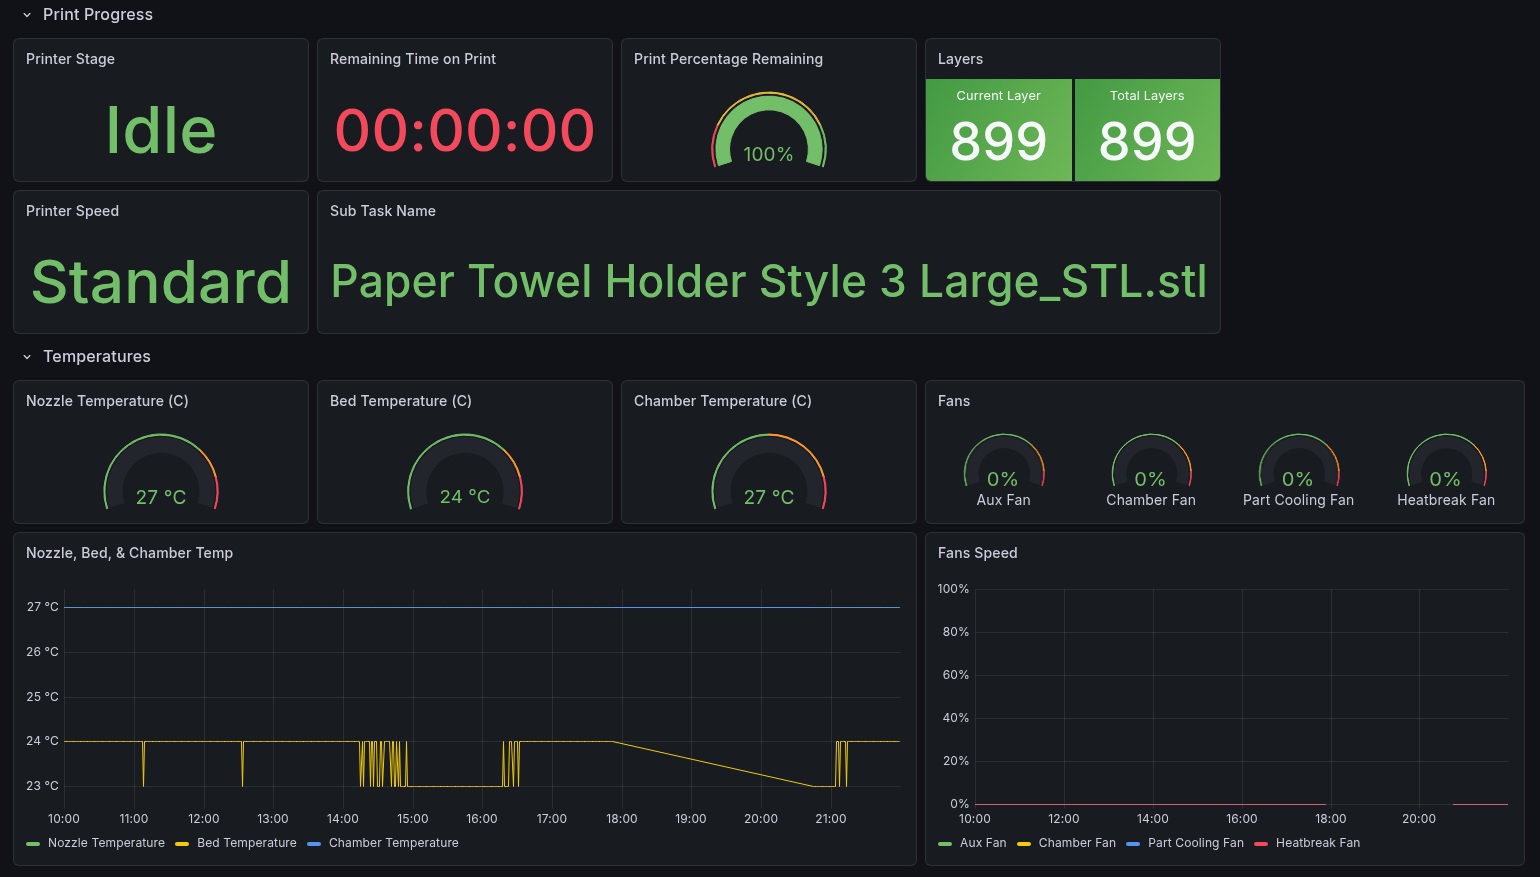
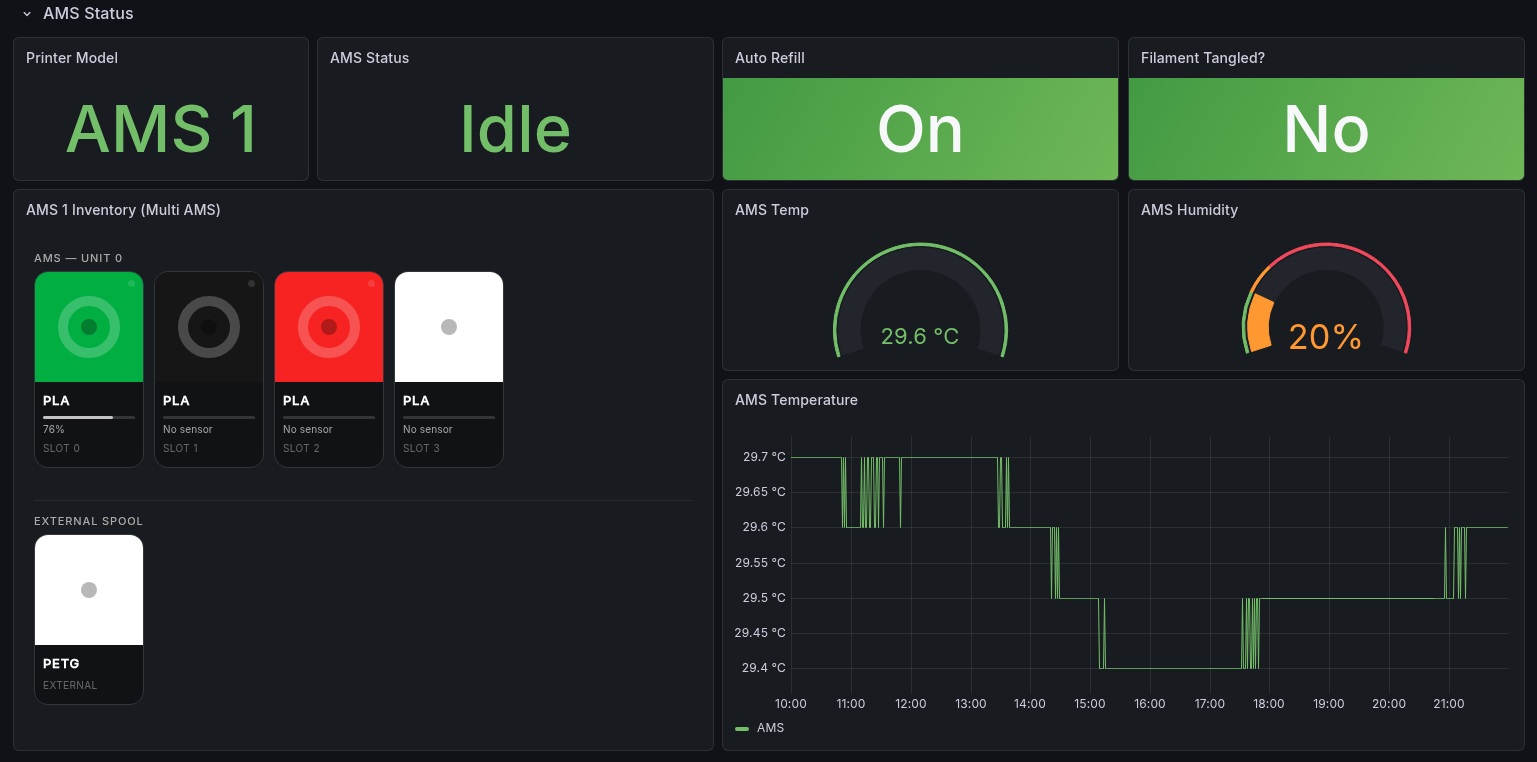
BambuLab 3D Printer: Grafana Dashboard
Real-time monitoring for BambuLab 3D printers: printer status, print progress, temperatures, fans, AMS filament inventory and drying, HMS errors, firmware, airduct, extruders, nozzles, lights and accessories. Use the Job and Printer dropdowns at the top to switch between printers; AMS units, extruders and fans are picked up automatically.
Panels for hardware your printer does not have show a placeholder ("No heater", "No dryer", "N/A") instead of an error.
Requirements
| Component | Version |
|---|---|
| Grafana | Built with 12.4, tested on 13.2 |
| Prometheus | 2.40+ |
| bambulab_metrics_exporter | 0.2.0+ (older versions leave the newer panels empty) |
Business Text plugin (marcusolsson-dynamictext-panel) | 6.x |
Business Text plugin (AMS inventory panel)
The AMS filament inventory panel uses the Business Text panel by Volkov Labs to draw one spool card per slot with the real filament color, type, remaining % bar and an active-slot indicator. Native panels cannot loop over slots or bind colors from label values, so this one panel needs the plugin. Every other panel is a built-in Grafana panel.
1. Install the plugin
Grafana CLI:
grafana-cli plugins install marcusolsson-dynamictext-panel
Docker:
environment:
  - GF_INSTALL_PLUGINS=marcusolsson-dynamictext-panel
Grafana UI: Administration → Plugins → search "Business Text" → Install.
Restart Grafana after installing.
2. Allow HTML in panels
Grafana sanitizes panel HTML by default, which strips the spool card styling. Turn sanitization off:
grafana.ini:
[panels]
disable_sanitize_html = true
or the environment variable (recommended for Docker):
GF_PANELS_DISABLE_SANITIZE_HTML=true
Docker Compose example:
services:
  grafana:
    image: grafana/grafana:latest
    environment:
      - GF_PANELS_DISABLE_SANITIZE_HTML=true
      - GF_INSTALL_PLUGINS=marcusolsson-dynamictext-panel
Restart Grafana. Without this the AMS panel shows plain text instead of spool cards.
Data collection
The bambulab_metrics_exporter connects to the printer over MQTT, either on your LAN (IP, serial, access code) or through Bambu Cloud, and exposes the telemetry as Prometheus metrics on port 9109. Run one exporter container per printer. The exporter has a built-in setup page at http://exporter-host:9109/auth.
BambuLab printer (LAN MQTT or Bambu Cloud)
        │
        ▼
bambulab_metrics_exporter  (:9109/metrics)
        │
        ▼
Prometheus  ──►  Grafana
Model detection covers the A1, A1 mini, A2L, P1P, P1S, P2S, X1, X1C, X1E, X2D, H2D, H2D Pro, H2S and H2C. Real-world validation so far is on an X1C.
Prometheus scrape config
scrape_configs:
  - job_name: bambulab
    scrape_interval: 15s
    scrape_timeout: 10s
    static_configs:
      - targets:
          - exporter-host:9109   # one target per printer / exporter
The dashboard's Job dropdown lists jobs whose name contains bambulab, so keep that in the job name (or edit the variable's regex).
Check that metrics are flowing at http://exporter-host:9109/metrics: you should see metrics prefixed with bambulab_.
Dashboard rows
Printer Status
Online state, printer model, gcode state (IDLE, RUNNING, FINISH, ...), error flag, SD card, chamber light, door, nozzle diameter, and the XCam AI features (first layer inspection, build plate detector, AI print monitor and its sensitivity).
Print Progress
Current print stage, time remaining, progress gauge, current/total layers, speed profile and the job name.
Temperatures
Nozzle, bed and chamber gauges (nozzle and bed scaled to their target), fan gauges (aux, chamber, part cooling, heatbreak), and temperature and fan trends.
AMS Status
AMS model, AMS status, auto refill, tangle detection setting, the AMS filament inventory (Business Text spool cards for every AMS unit plus the external spool), and AMS temperature and humidity per unit.
Health & Firmware
Active HMS errors by severity and by module, firmware update available, printer firmware version and a firmware table for every module (mainboard, toolhead, AMS units, ...).
Chamber, Airduct & Accessories
Chamber heater state and target (X1E, X2D, H2 series), airduct mode and per-fan speeds (P2S, X2D, H2 series), mounted tool head (laser, cutter, cooling fan), installed accessories (filament buffer, external exhaust fan, fire extinguisher, ...), light states, and timelapse storage (X2D).
Extruders & Nozzles
Filament sensor and loaded AMS slot per extruder (single and dual extruder), nozzle print time and wear.
AMS Drying
Drying time left, drying target temperature and dryer state for AMS 2 Pro and AMS HT units.
Trending Metrics
Online history, WiFi signal, remaining time, HMS errors over time, nozzle temperature, machine stage, print errors and airduct fans.
Key metrics
| Metric | Description |
|---|---|
bambulab_printer_up | 1 when the last poll returned data |
bambulab_printer_connected | 1 while the MQTT connection is up |
bambulab_printer_gcode_state{state} | Current gcode state (one-hot) |
bambulab_print_progress_percent | Print progress 0-100 |
bambulab_print_remaining_seconds | Estimated time remaining |
bambulab_nozzle_temperature_celsius / bambulab_bed_temperature_celsius | Current temperatures (plus _target_ variants) |
bambulab_chamber_temperature_celsius | Chamber temperature (models with a chamber sensor) |
bambulab_hms_active_errors{severity} | Active HMS errors: fatal, serious, common, info |
bambulab_ams_slot_tray_info / bambulab_ams_slot_remaining_percent | Filament per AMS slot |
bambulab_ams_unit_humidity / bambulab_ams_unit_temperature_celsius | AMS environment per unit |
bambulab_ams_drying_remaining_seconds{ams_id} | Drying time left (AMS 2 Pro, AMS HT) |
bambulab_firmware_update_available | 1 when a firmware update is offered |
bambulab_light_mode_info{light,mode} | Light states |
Full reference: Metrics Reference.
Alerting suggestions
| Alert | Condition |
|---|---|
| Exporter not polling | bambulab_printer_up == 0 for 2 minutes |
| Printer disconnected | bambulab_printer_connected == 0 for 1 minute |
| Serious HMS error | sum by (printer_name) (bambulab_hms_active_errors{severity=~"fatal|serious"}) > 0 |
| Printer error | bambulab_printer_error == 1 |
| AMS humid | bambulab_ams_unit_humidity_index >= 4 |
| Low filament | 15 >= bambulab_ams_slot_remaining_percent (15% or less left) |
| Firmware update | bambulab_firmware_update_available == 1 |
Ready-to-use rules: prometheus.alerts.yml.
License
MIT, free to use, modify and share.
Data source config
Collector config:
Upload an updated version of an exported dashboard.json file from Grafana
| Revision | Description | Created | |
|---|---|---|---|
| Download |