Lemmy
Lemmy dashboard powered by Prometheus metrics
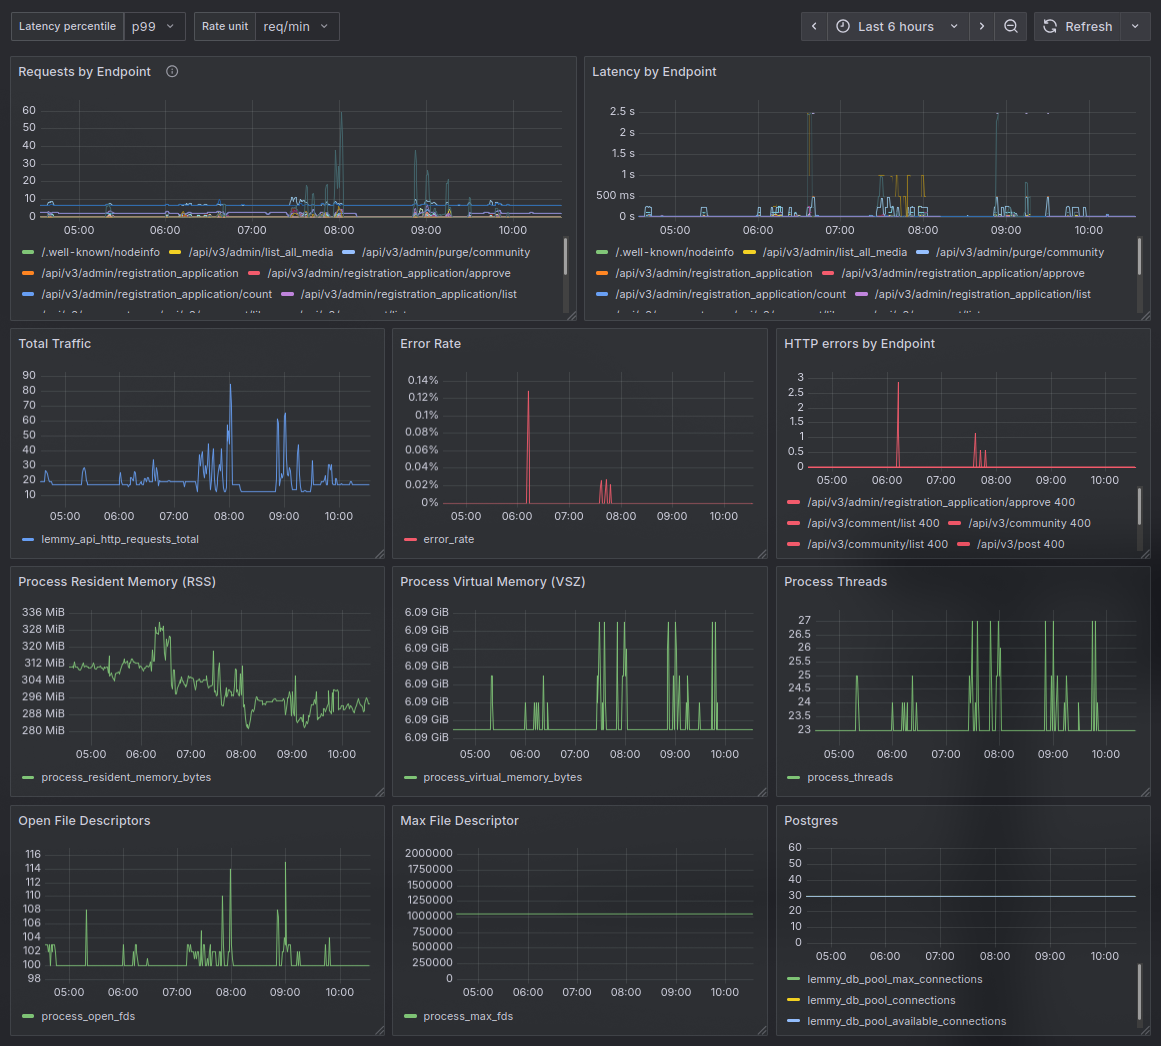
Lemmy Grafana Dashboard
A dashboard for monitoring a Lemmy instance using metrics exposed by Lemmy's built-in Prometheus endpoint.
What this dashboard shows
HTTP Traffic
Request rate by endpoint
Total traffic
Latency percentiles (p50/p90/p95/p99) by endpoint
Error rate (4xx/5xx)
HTTP errors broken down by endpoint and status code
Process Health
- Resident memory (RSS) and virtual memory (VSZ)
- Thread count
- Open and max file descriptors
Database
- PostgreSQL connection pool usage (max, active, and available connections)
Metrics collection
Information on metric collection can be found on Lemmy docs.
Data source config
Collector type:
Collector plugins:
Collector config:
Revisions
Upload an updated version of an exported dashboard.json file from Grafana
| Revision | Description | Created | |
|---|---|---|---|
| Download |