Report - System & DB
System (Node Exporter) + Database (PostgreSQL/postgres_exporter) report. Process view: (1) Process overview row uses Node Exporter only (processes by state — like htop count). (2) Top 10 Processes (htop-style) tables and graphs need process_exporter (https://github.com/ncabatoff/process-exporter) scraped by Prometheus; set Instance (Process) to your process_exporter instance (e.g. host:9256). After import: select Prometheus datasource; set Job/Node and Instance (DB). References: Node Exporter (node_cpu_seconds_total, node_memory_*, node_processes_state), PostgreSQL exporter (pg_up, pg_stat_database_*), process-exporter (namedprocess_namegroup_*).
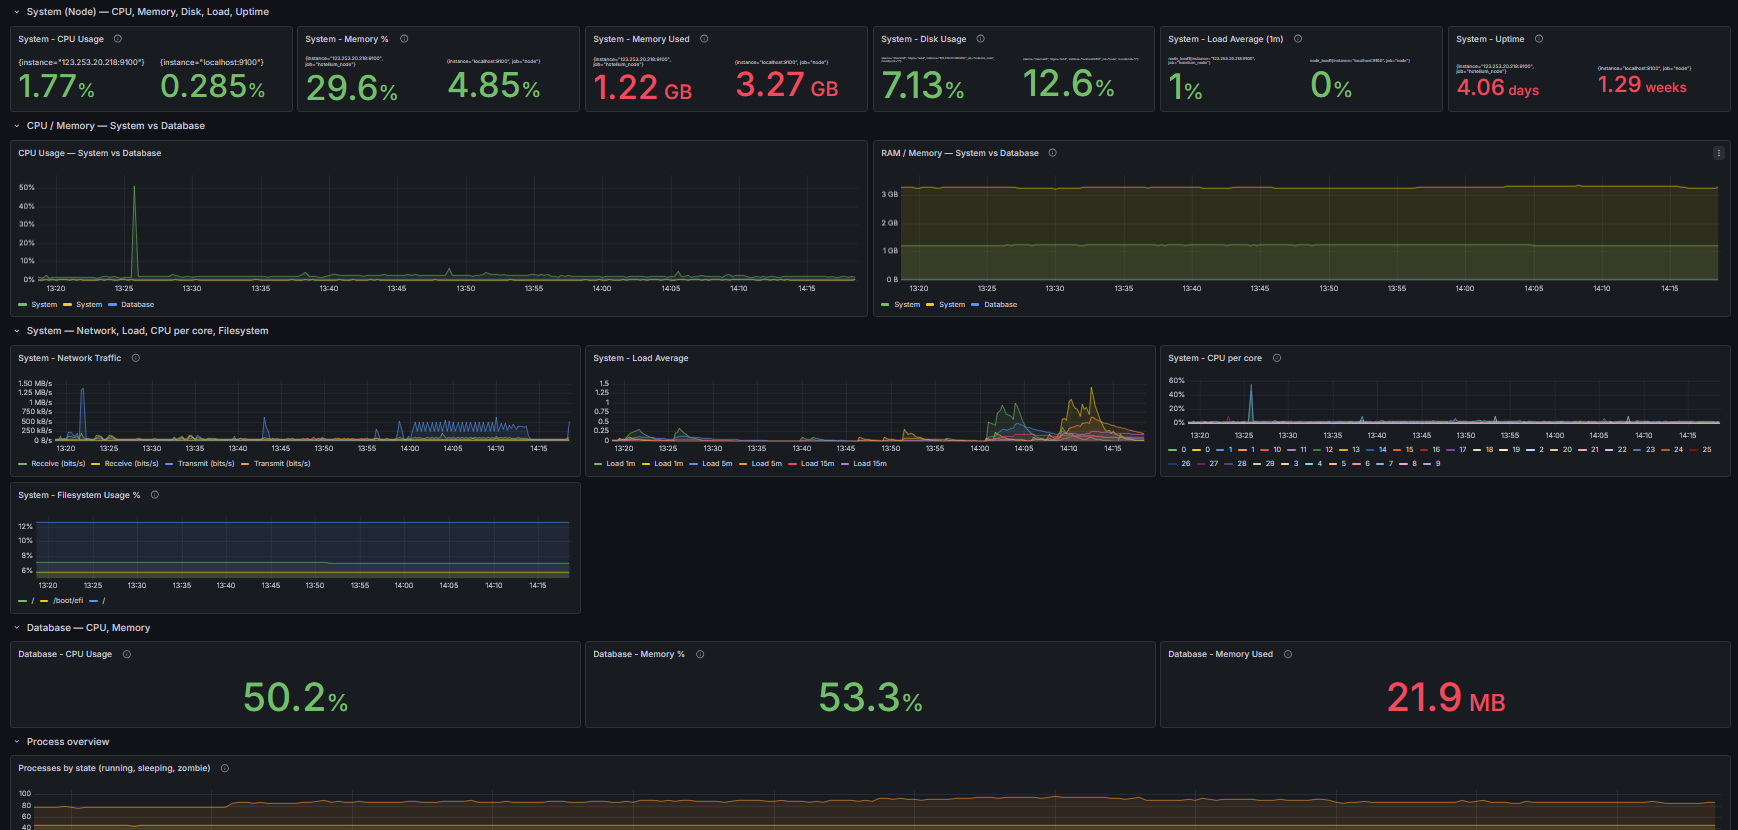
System & PostgreSQL Monitoring Dashboard
A Grafana dashboard to monitor system resources and PostgreSQL performance in a single view.
Features
- CPU usage monitoring
- Memory usage monitoring
- Disk and filesystem usage
- Network traffic
- Top CPU and memory processes
- PostgreSQL performance metrics
Requirements
- Grafana
- Prometheus
- Node Exporter
- PostgreSQL Exporter
Process Exporter Setup
This dashboard uses process_exporter to display the Top 10 processes.
Install process_exporter and configure it to monitor processes such as:
- postgres
- grafana
- prometheus
- system services
Repository: https://github.com/ncabatoff/process-exporter
Import Dashboard
- Download the dashboard JSON file.
- Open Grafana.
- Navigate to Dashboards → Import.
- Upload the JSON file or paste the dashboard ID.
Data source config
Collector config:
Upload an updated version of an exported dashboard.json file from Grafana
| Revision | Description | Created | |
|---|---|---|---|
| Download |
Azure Cosmos DB
With the Grafana plugin for Azure Cosmos DB, you can quickly visualize and query your Azure Cosmos DB data from within Grafana.
Learn more