System Performance Metrics - Overview (MetricsHub)
Use Cases
- Quickly assess overall system status
- Track the availability and utilization of servers
- Detect performance bottlenecks
Prerequisites
- MetricsHub installed and configured
- A Prometheus server configured to expose the collected metrics
- The System Performance Metrics (MetricsHub®) Grafana dashboard
MetricsHub Overview
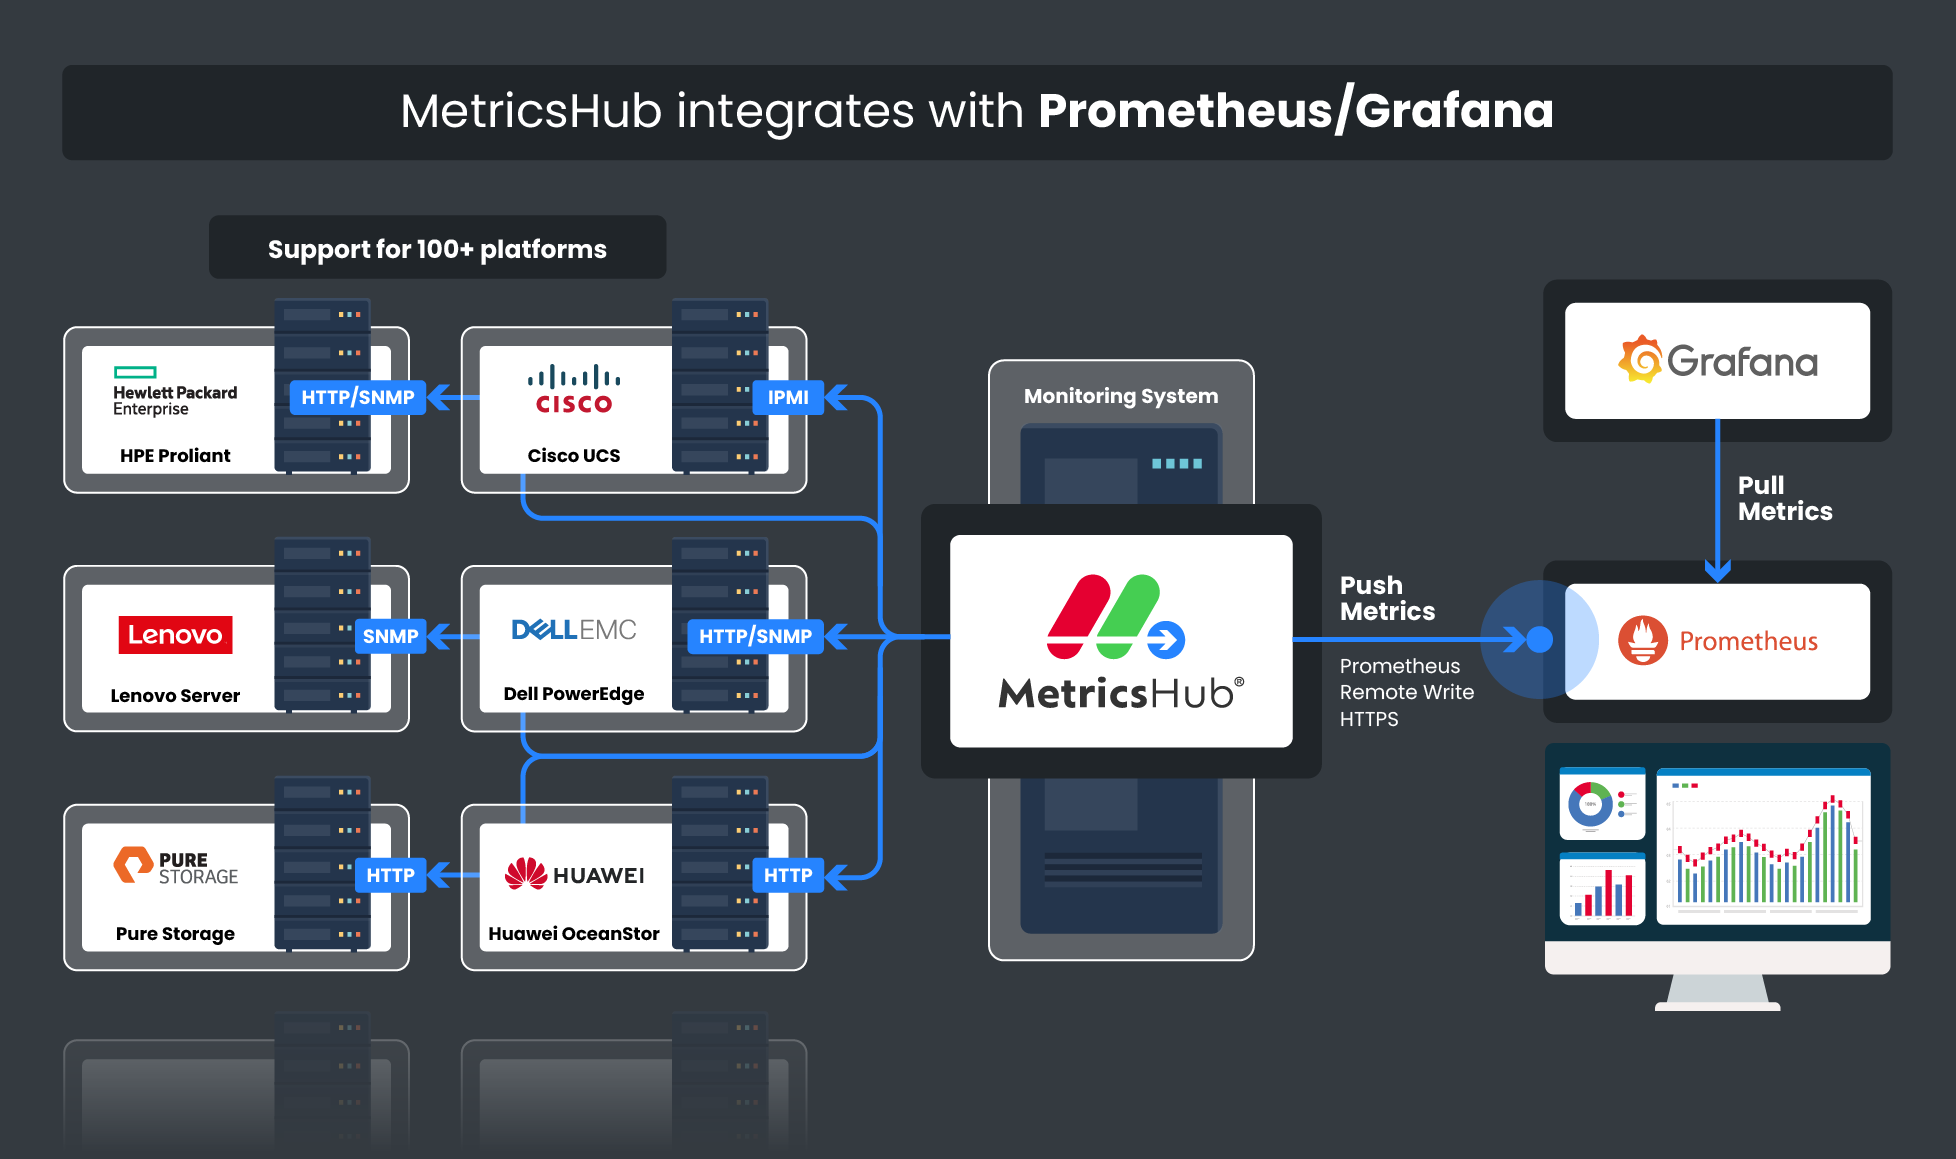
MetricsHub is a universal metrics collection agent for OpenTelemetry that extracts metrics from any local or remote resource such as a host, service, or application and sends the data to Grafana.
It is available in two editions: the Community Edition (free) and the Enterprise Edition (licensed). Both provide system monitoring capabilities, and the Enterprise Edition adds seamless integration for advanced environments. You can try the Enterprise Edition free for 30 days to explore its full capabilities. Compare both editions.
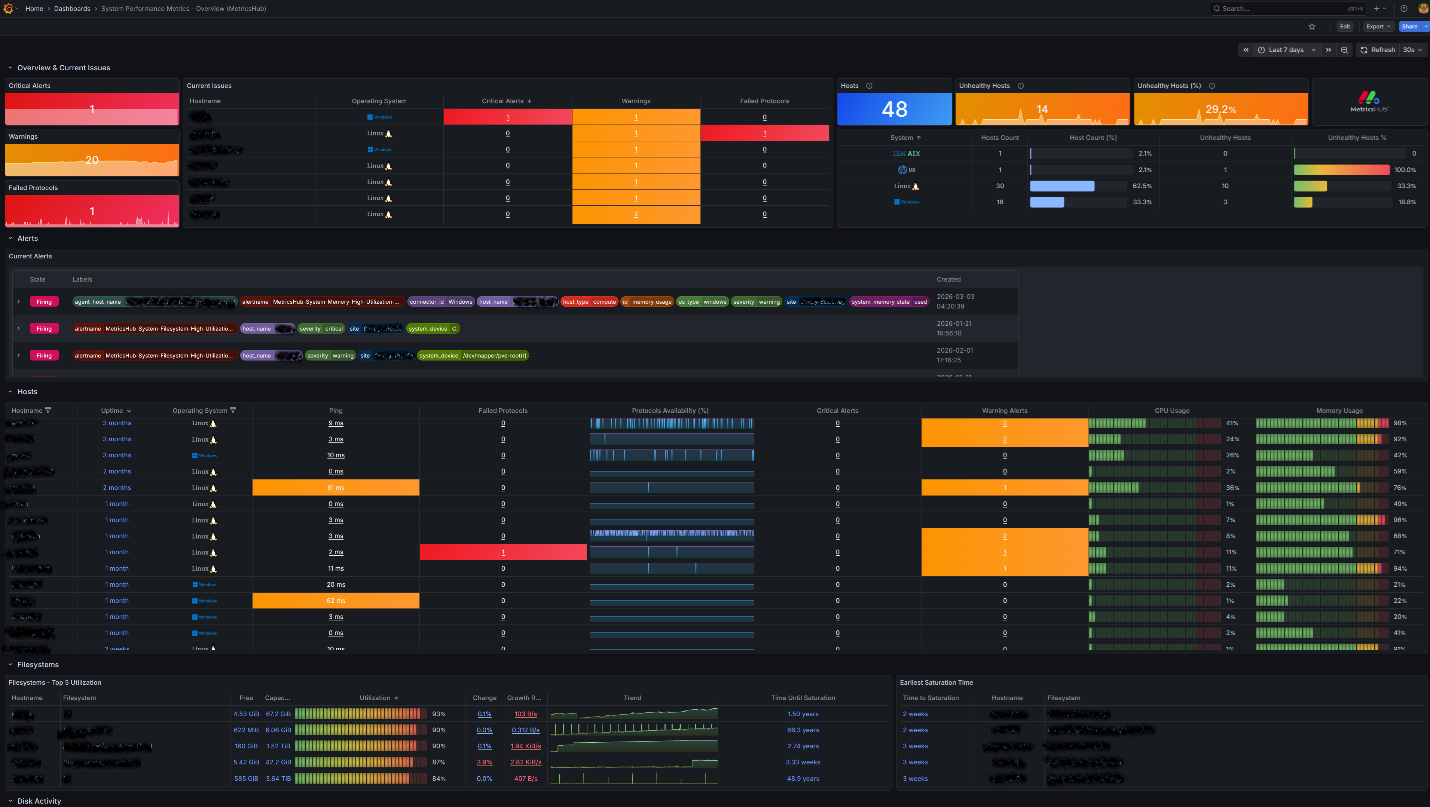
Key Features of System Performance Metrics – Overview (MetricsHub®) Dashboard
- Unified monitoring across modern and legacy operating systems: The only Grafana dashboard covering IBM AIX, HP-UX, Windows, and Linux without distinction.
- Comprehensive system overview: Access key system information, including uptime, alerts, CPU usage, and memory usage.
- Protocol health and responsiveness: Monitor the availability and response times of key protocols like HTTP, Ping, SNMP, SSH, WBEM, and WMI.
- Activity metrics: Visualize the top filesystems by utilization, top drives by traffic and utilization, and top network interfaces by traffic and utilization.
You can access more detailed server information and gain insight into CPU usage, memory usage, filesystem usage, and network traffic with the System Performance Metrics (MetricsHub) dashboard.
Setup and Configuration
- Download and install MetricsHub
- Configure MetricsHub
- Send telemetry to Prometheus
- Import the Systems Performance Metrics (MetricsHub) dashboard into Grafana.
Other MetricsHub Grafana Dashboards
MetricsHub provides several Grafana dashboards to help you monitor your infrastructure at different levels, from a global view of all monitored environments to detailed metrics for individual systems.
- System Performance Metrics (MetricsHub) Dashboard Visualizes key system performance indicators, including CPU usage, memory consumption, filesystem capacity, network traffic, and protocol response time, for Linux, Windows, HP-UX, and IBM AIX systems.
- Hardware Main (MetricsHub) Dashboard Provides a centralized view of hardware health and performance metrics across all monitored environments. It aggregates telemetry collected by MetricsHub to help you quickly assess the status of your infrastructure.
- Hardware Site (MetricsHub) Dashboard Displays metrics associated with a specific site, such as a data center or server room, and the hosts monitored within that environment.
- Hardware Host (MetricsHub) Dashboard Focuses on a single monitored host and its internal components, providing detailed visibility into hardware health and performance metrics.
Data source config
Collector config:
Upload an updated version of an exported dashboard.json file from Grafana
| Revision | Description | Created | |
|---|---|---|---|
| Download |