
Azure / Insights / Virtual Machines - OpenTelemetry - Detailed Metrics
Provides detailed monitoring of Azure Virtual Machines using OpenTelemetry metrics collected by VM Insights. Includes an overview of uptime, CPU core count, CPU load averages, and memory limits, plus deep-dive sections for CPU (utilization, per-core, by state, top processes), memory (free, used, utilization, by state), disk I/O (throughput, operations, top processes, file system usage, paging/swap), and network (I/O, packets, connections by protocol, dropped packets, errors). Scoped by subscription, resource group, and VM.
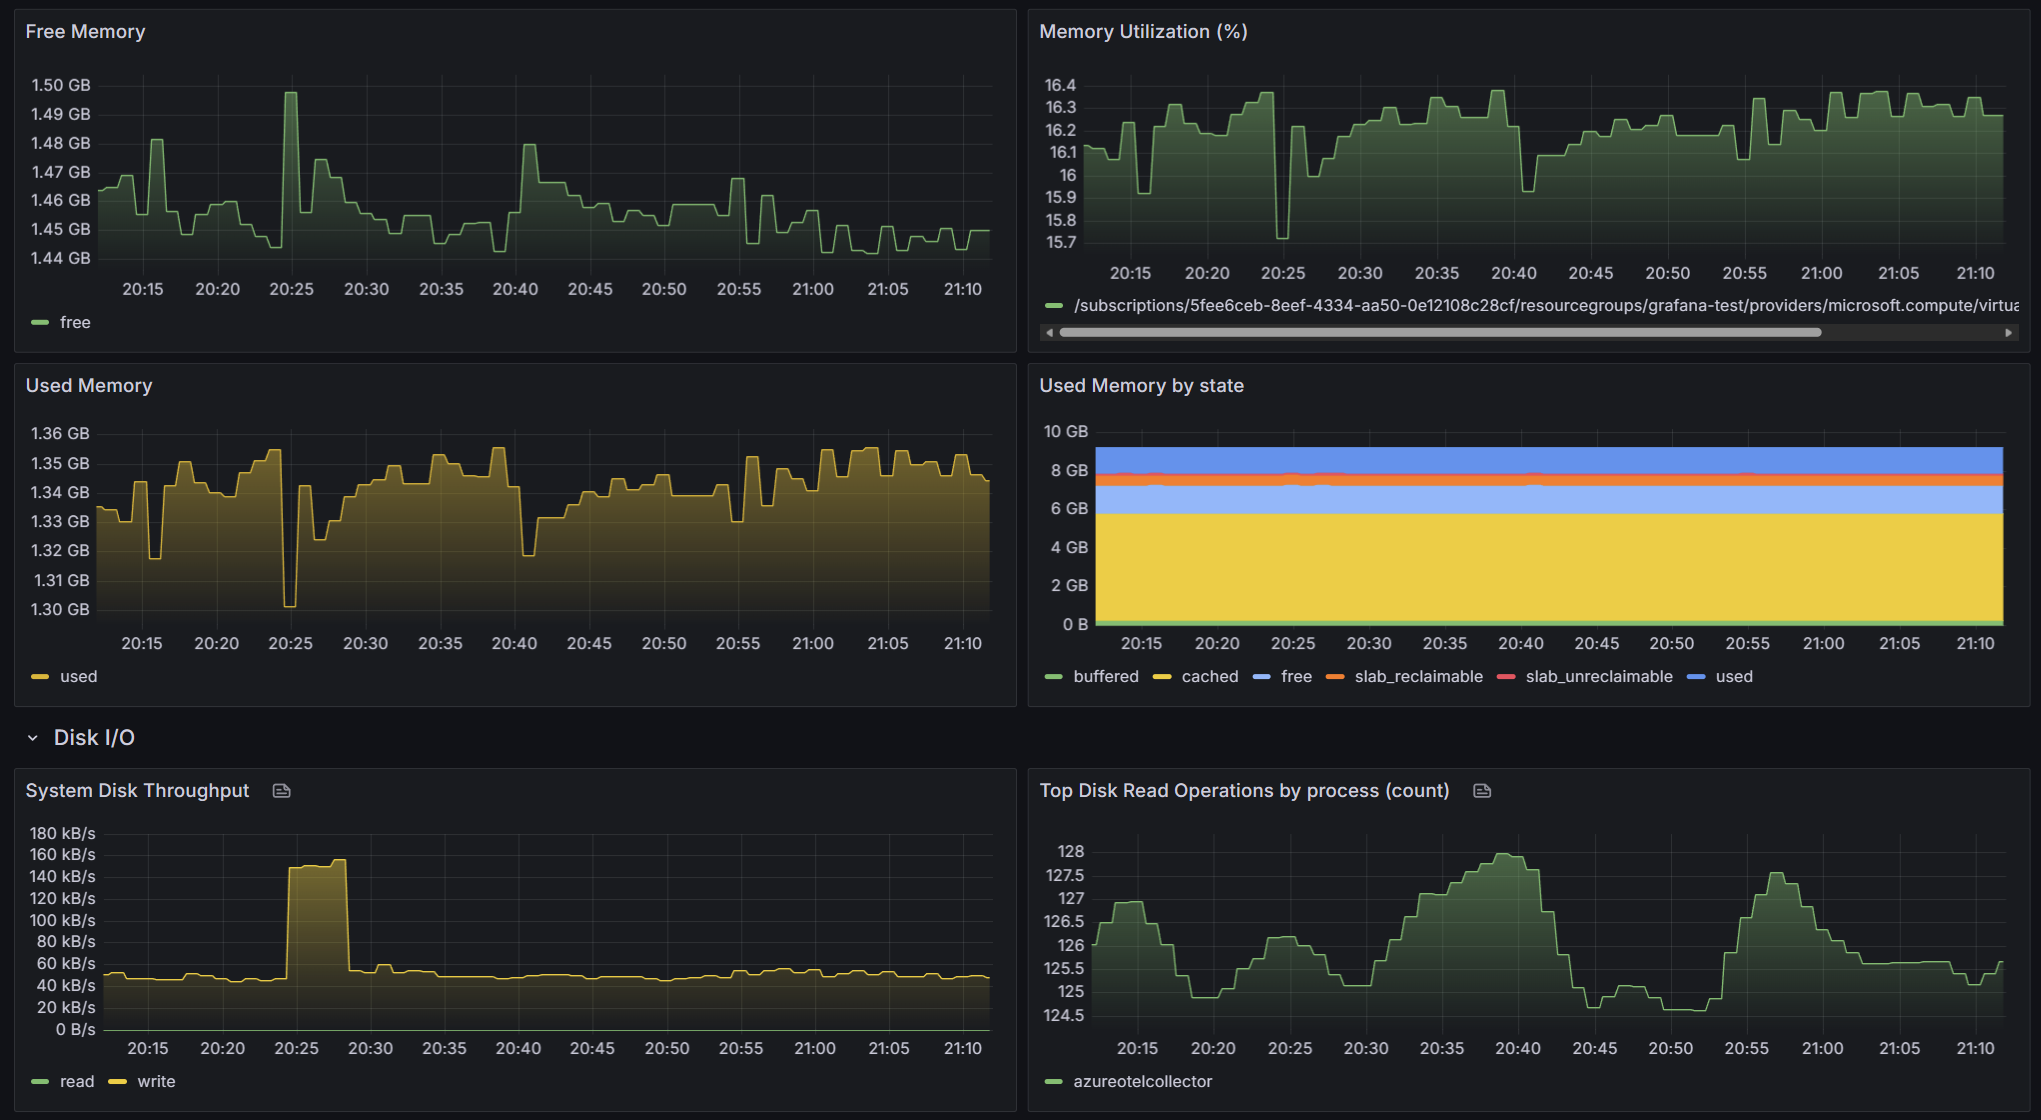
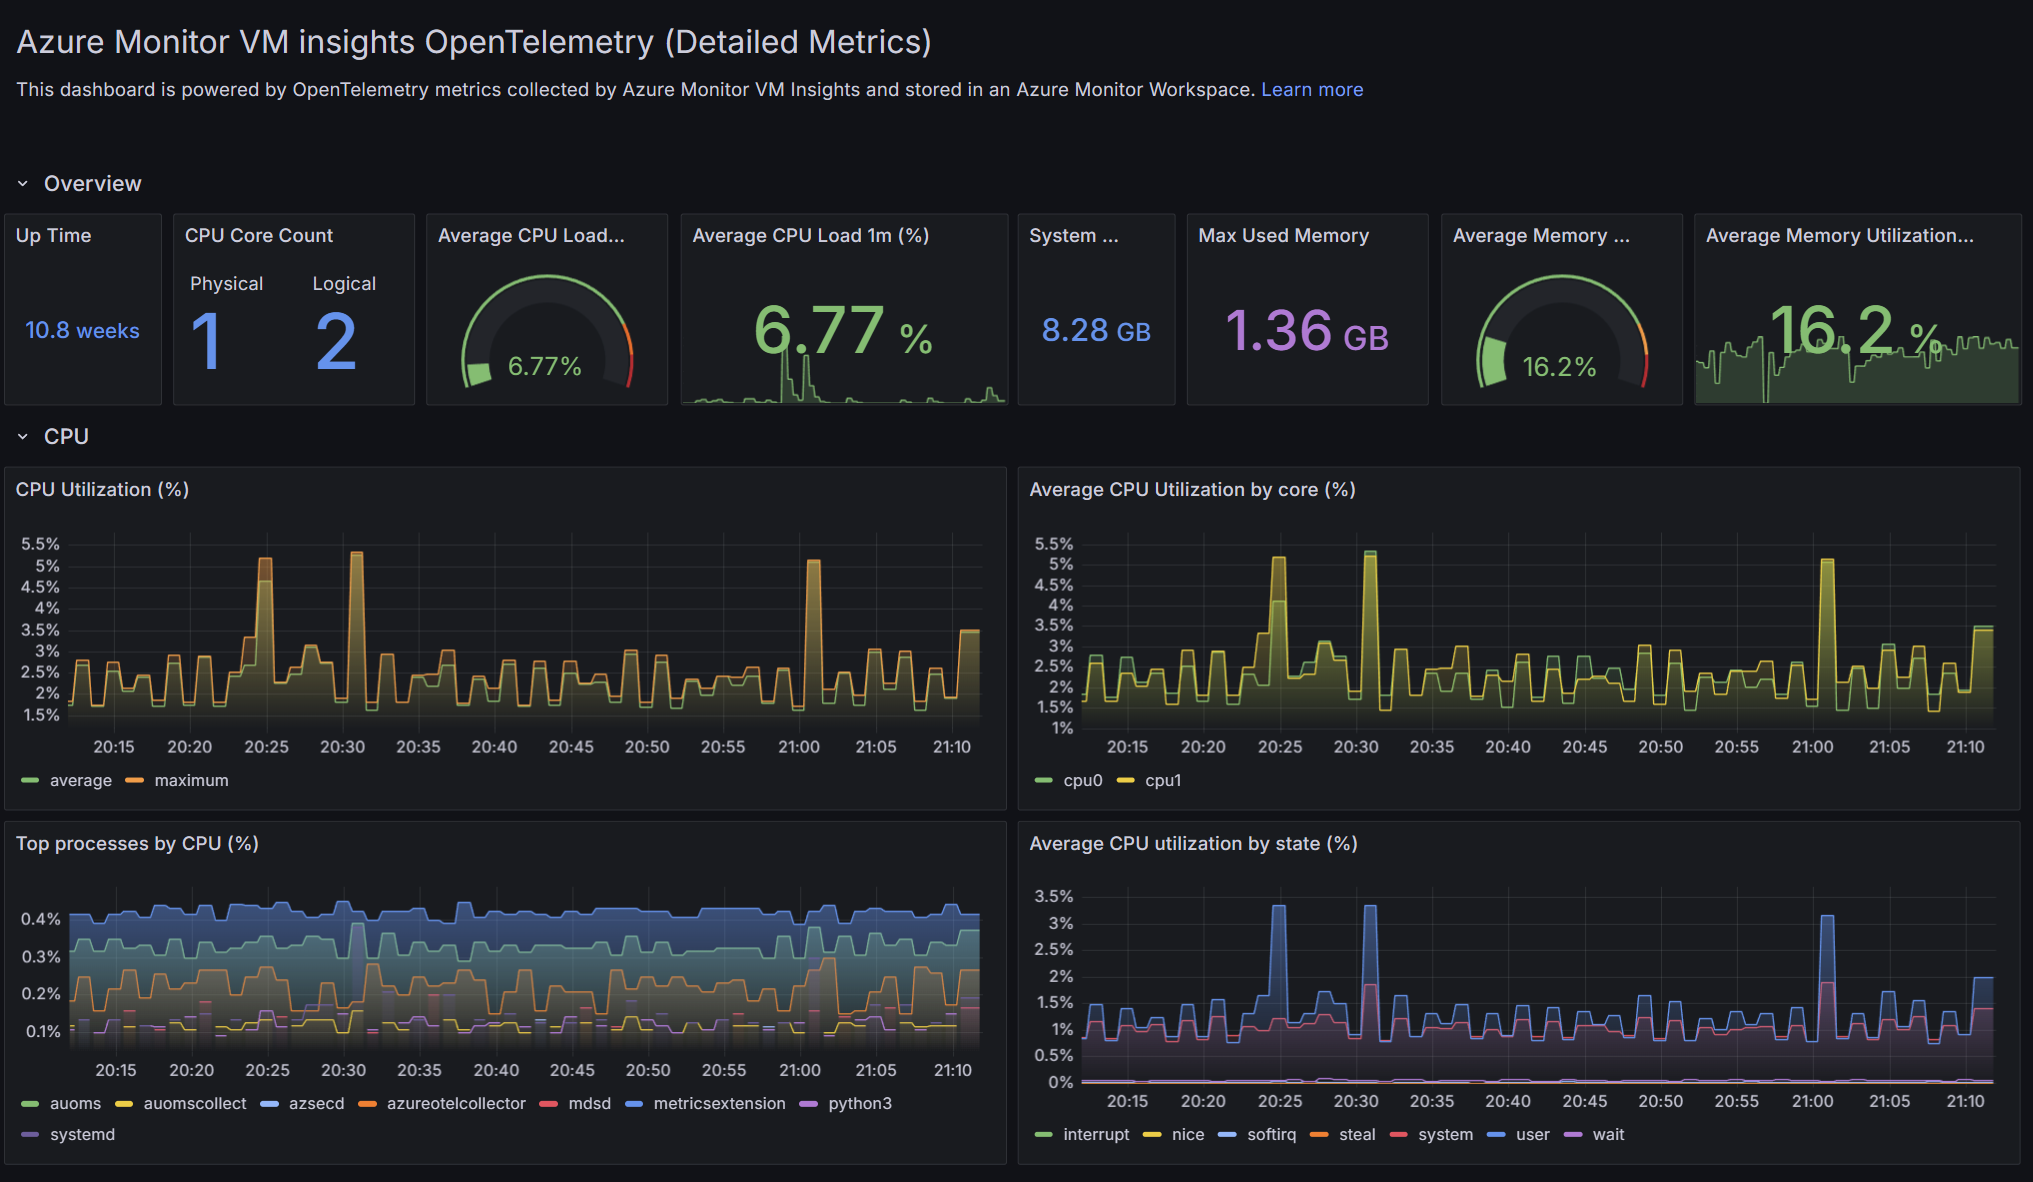
The Azure / Insights / Virtual Machines - OpenTelemetry - Detailed Metrics dashboard uses the prometheus data source to create a Grafana dashboard with the gauge, piechart, stat, text and timeseries panels.
Data source config
Collector type:
Collector plugins:
Collector config:
Revisions
Upload an updated version of an exported dashboard.json file from Grafana
| Revision | Description | Created | |
|---|---|---|---|
| Download |

Azure Cosmos DB

With the Grafana plugin for Azure Cosmos DB, you can quickly visualize and query your Azure Cosmos DB data from within Grafana.
Learn more