Azure / Insights / Virtual Machines - OpenTelemetry - Default Metrics
Monitors Azure Virtual Machines using OpenTelemetry default metrics collected by VM Insights. Displays CPU utilization (overall, per-core, and by state), memory usage and utilization, disk I/O and operations, file system consumption, and network throughput, errors, and dropped packets. Scoped by subscription, resource group, and VM.
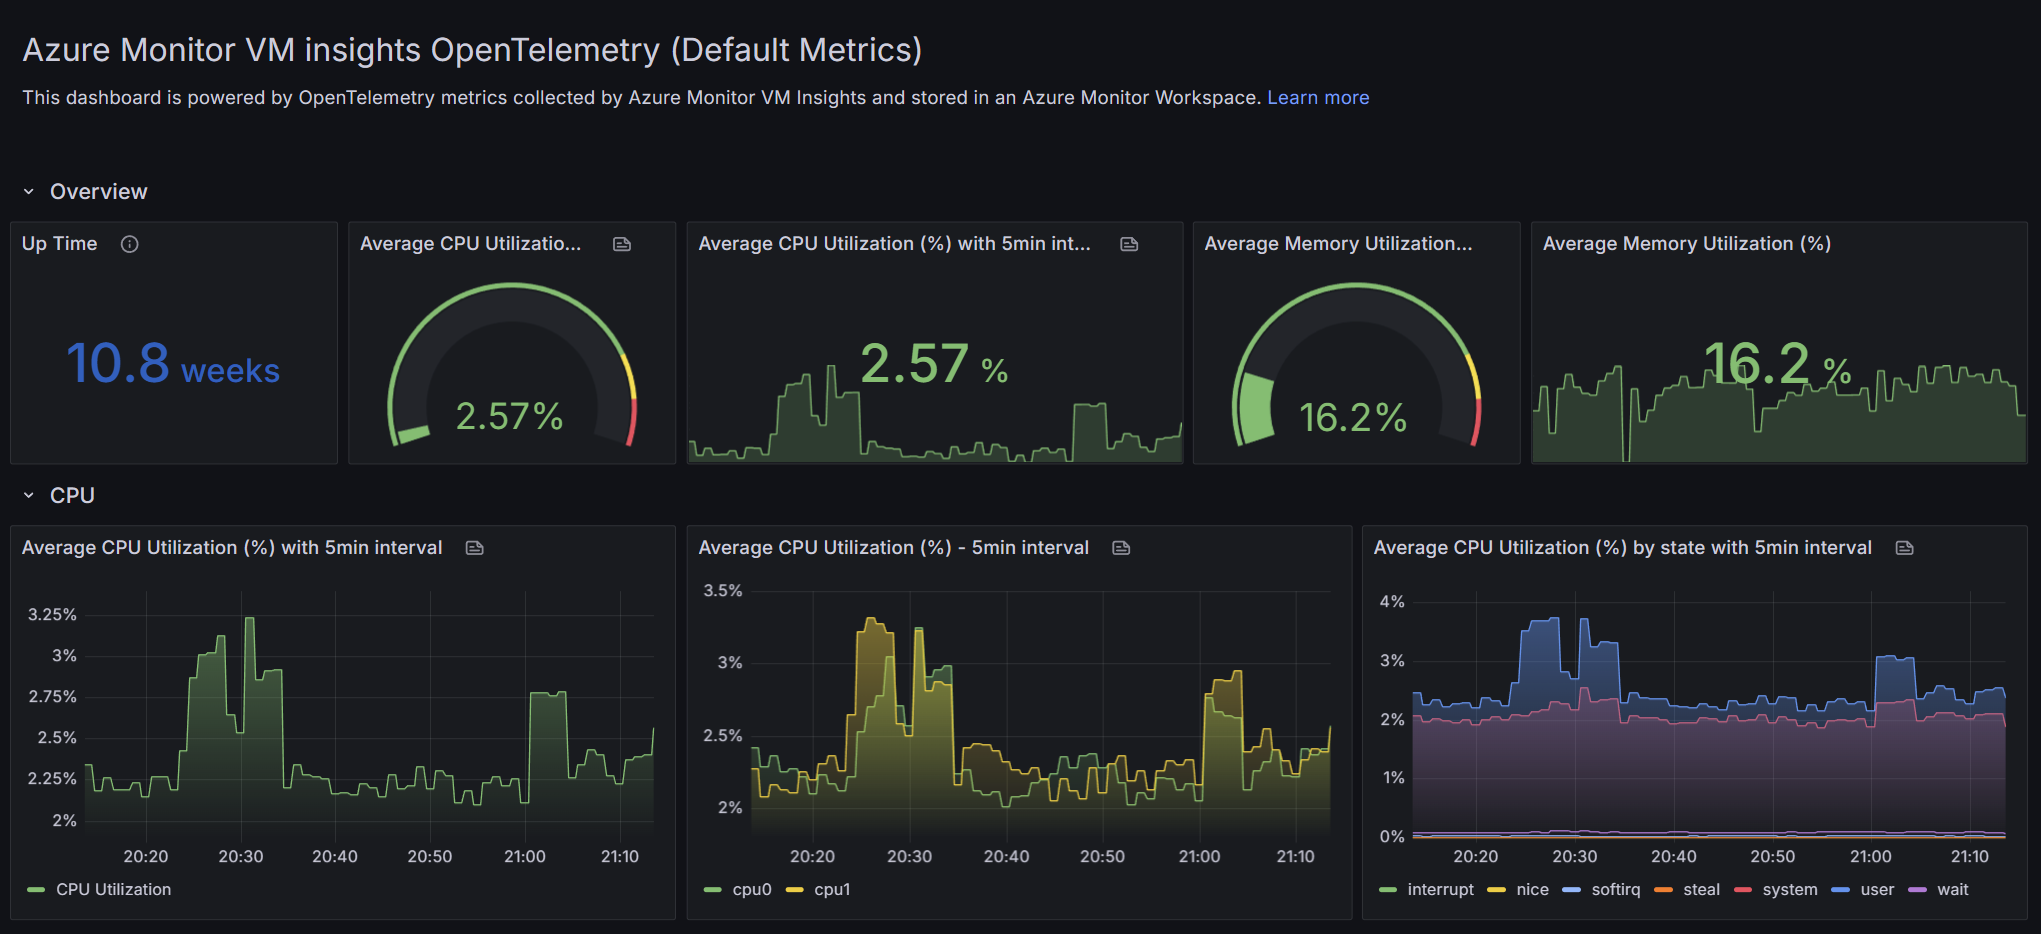
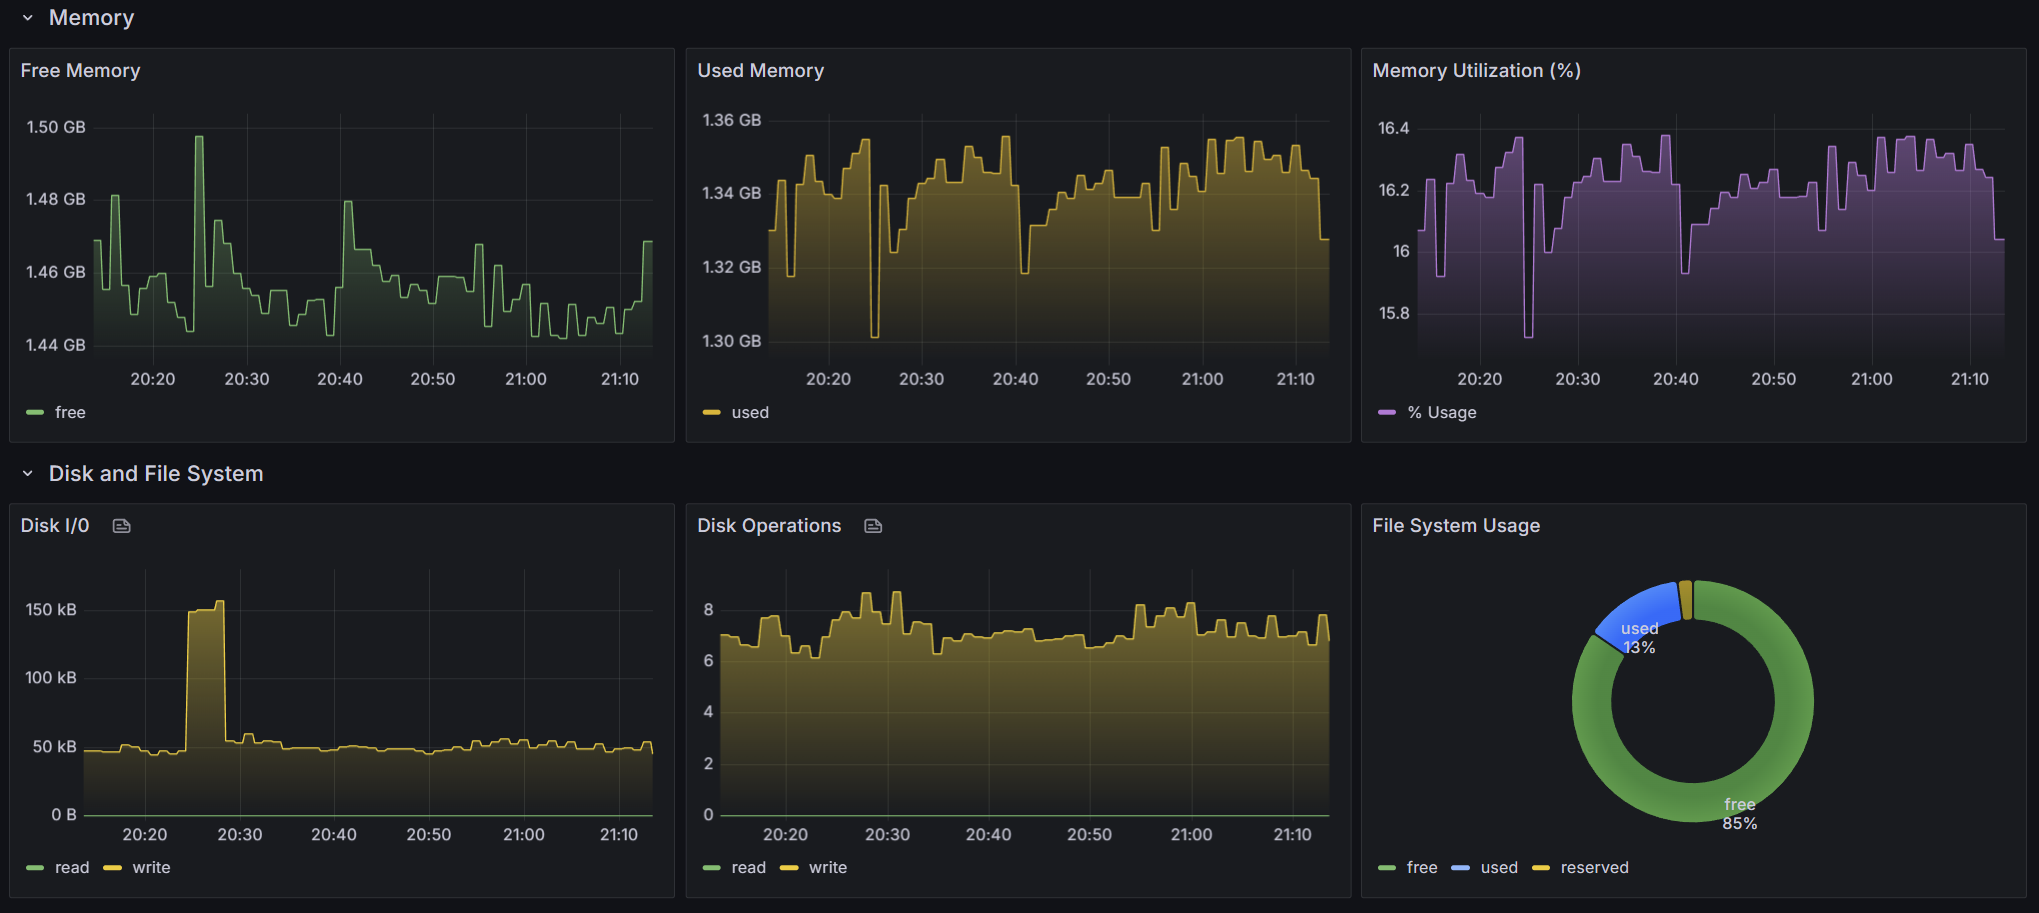
The Azure / Insights / Virtual Machines - OpenTelemetry - Default Metrics dashboard uses the prometheus data source to create a Grafana dashboard with the gauge, piechart, stat, text and timeseries panels.
Data source config
Collector type:
Collector plugins:
Collector config:
Revisions
Upload an updated version of an exported dashboard.json file from Grafana
| Revision | Description | Created | |
|---|---|---|---|
| Download |
Azure Cosmos DB
With the Grafana plugin for Azure Cosmos DB, you can quickly visualize and query your Azure Cosmos DB data from within Grafana.
Learn more