Restate Usage Monitor
Getting started with restate monitoring
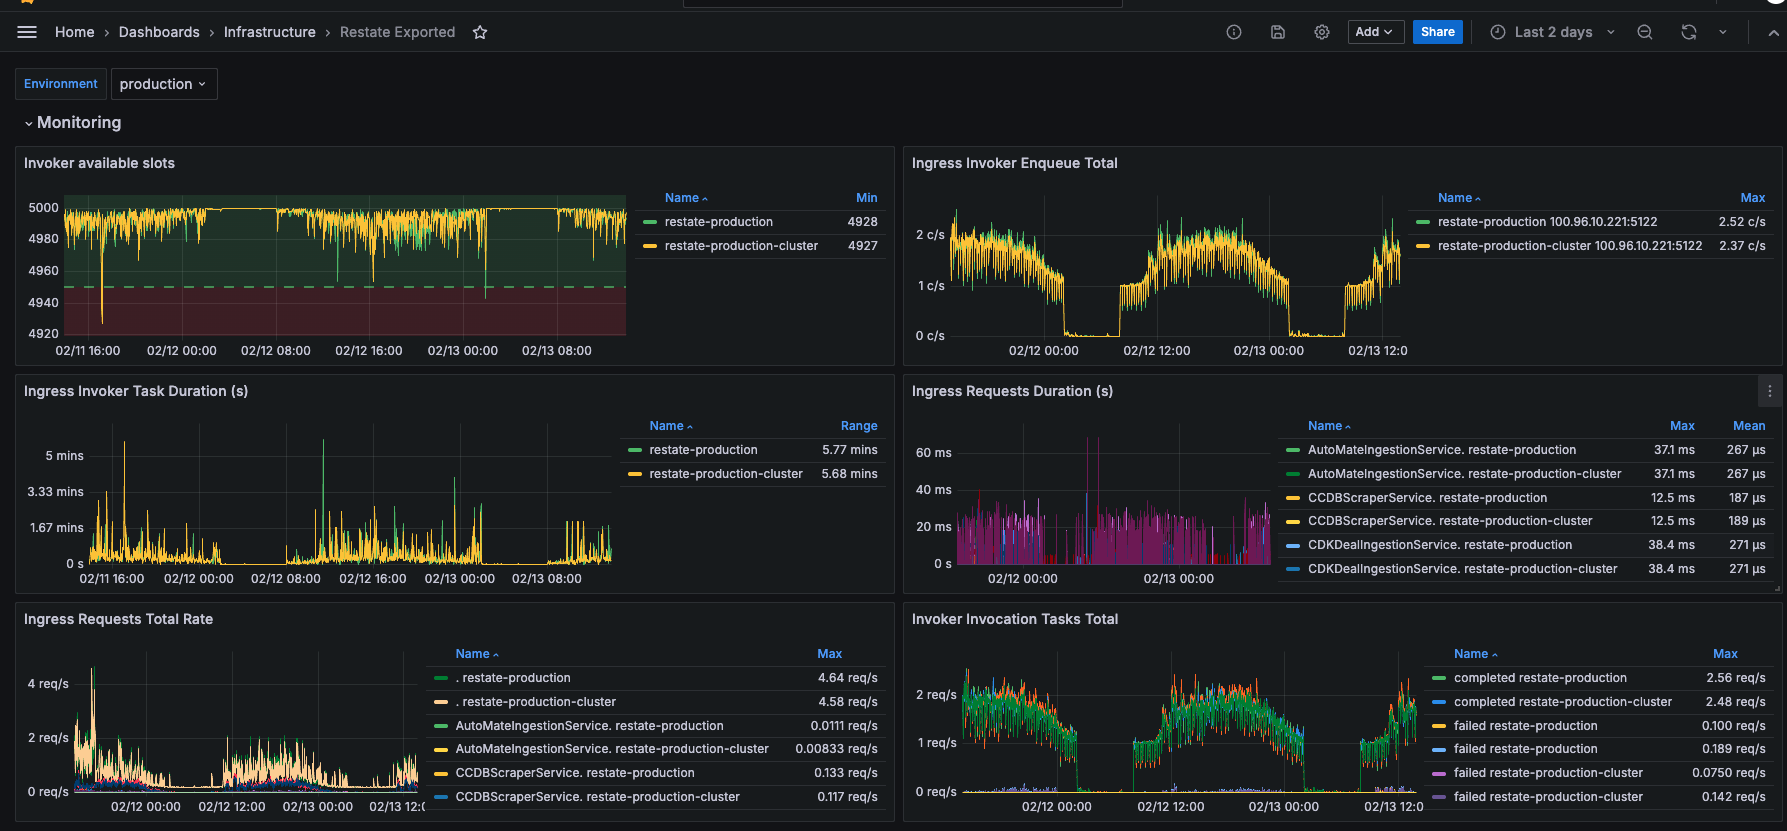
Restate Monitoring
A monitoring chart for prometheus data exported by restate
- Invoker available slots
- Ingress Invoker Enqueue Total
- Ingress Invoker Task Duration
- Ingress Request Duration
- Ingress Request Total Rate
- Invoker Invocation Tasks Total
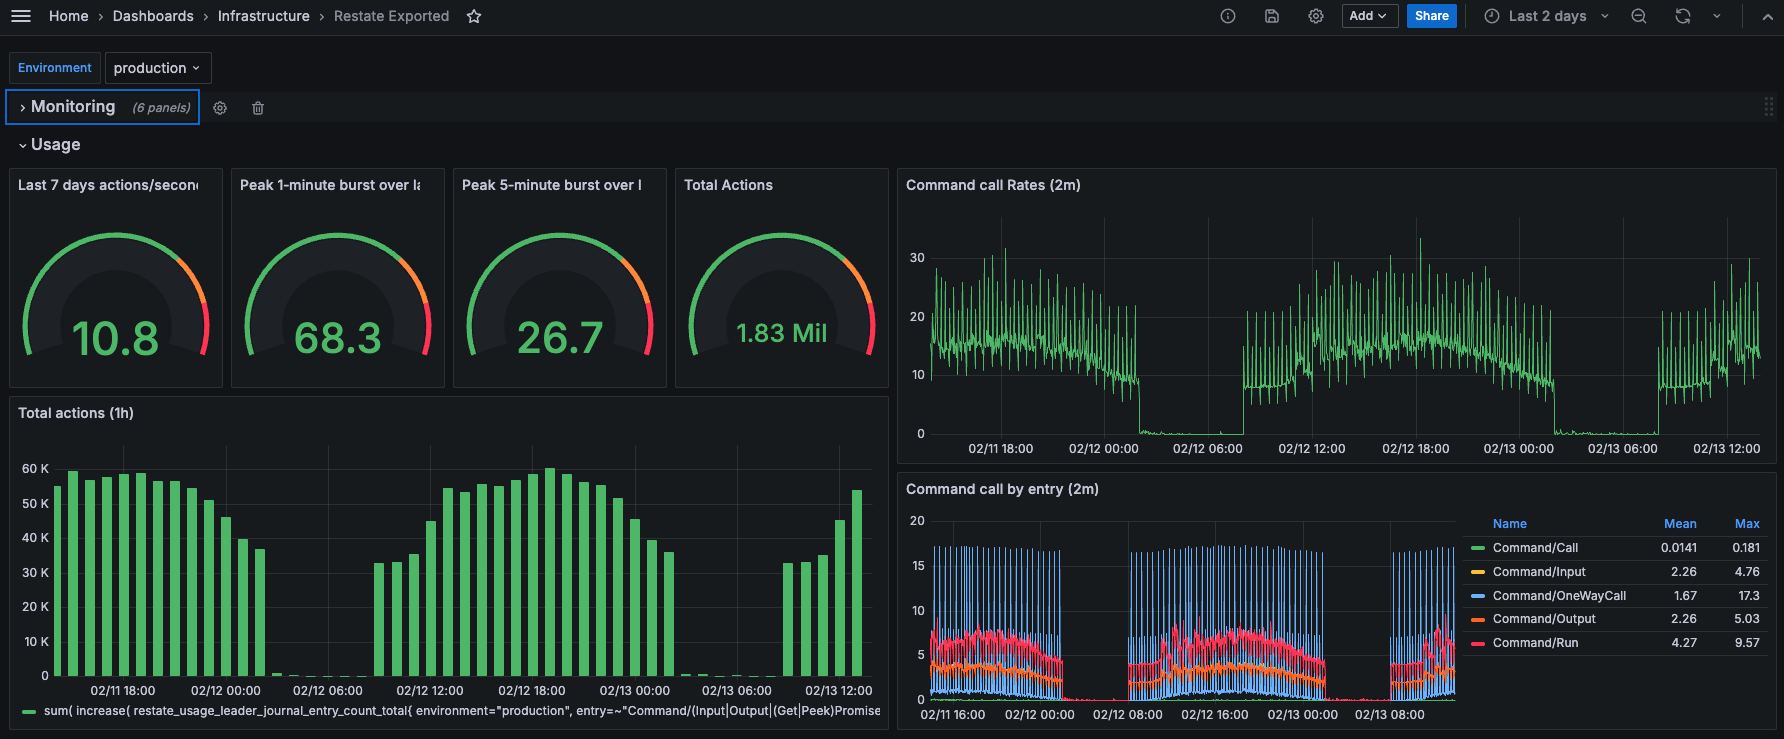
Usage Monitoring
- Last 7 days actions/second
- Peak 1-minute burst over last 7 days
- Peak 5-minute burst over last 7 days
- Total actions over period
- Total actions timeseries
- Comand call Rate timeseries
- Command call by entry timeseries
Feedback is very welcome. Check queries.
Data source config
Collector type:
Collector plugins:
Collector config:
Revisions
Upload an updated version of an exported dashboard.json file from Grafana
| Revision | Description | Created | |
|---|---|---|---|
| Download |