
Logs / App v2
Log Viewer Dashboard for Loki
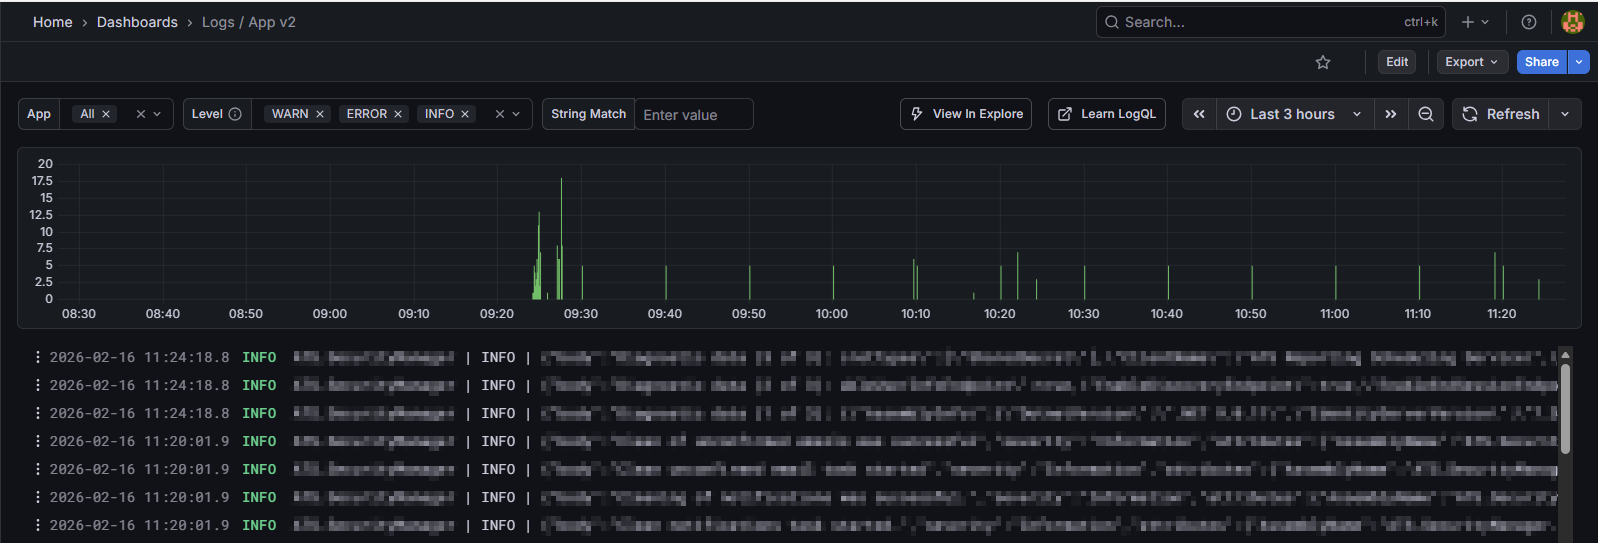
Extended copy of original dash 13639 Added multi select in variables and severity(level) variable
Dashboard to see Loki log entries, intended use is to see and list Windows service logs in this dash.
Data source config
Collector type:
Collector plugins:
Collector config:
Revisions
Upload an updated version of an exported dashboard.json file from Grafana
| Revision | Description | Created | |
|---|---|---|---|
| Download |

Grafana Loki (self-hosted)

Easily monitor Grafana Loki (self-hosted), a horizontally scalable, highly available, multi-tenant log aggregation system inspired by Prometheus, with Grafana Cloud's out-of-the-box monitoring solution.
Learn more