
Apache DolphinScheduler Monitoring Dashboard
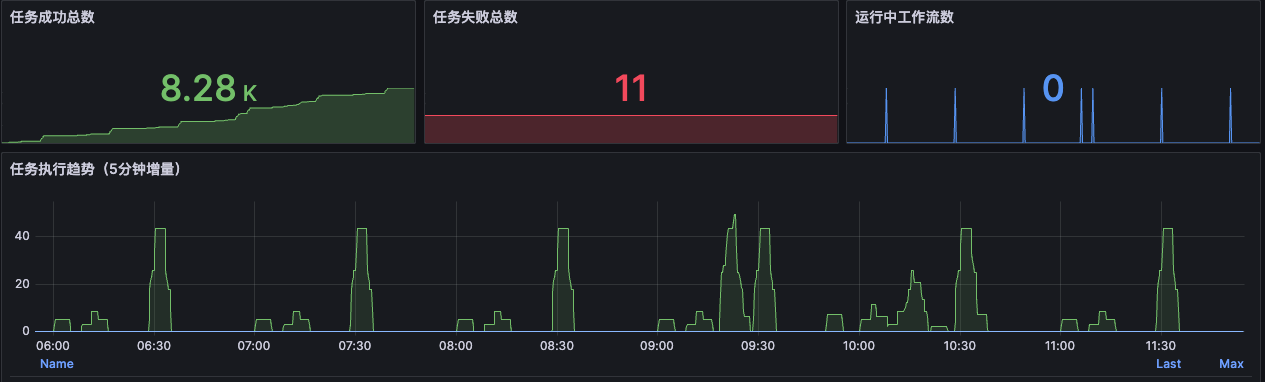
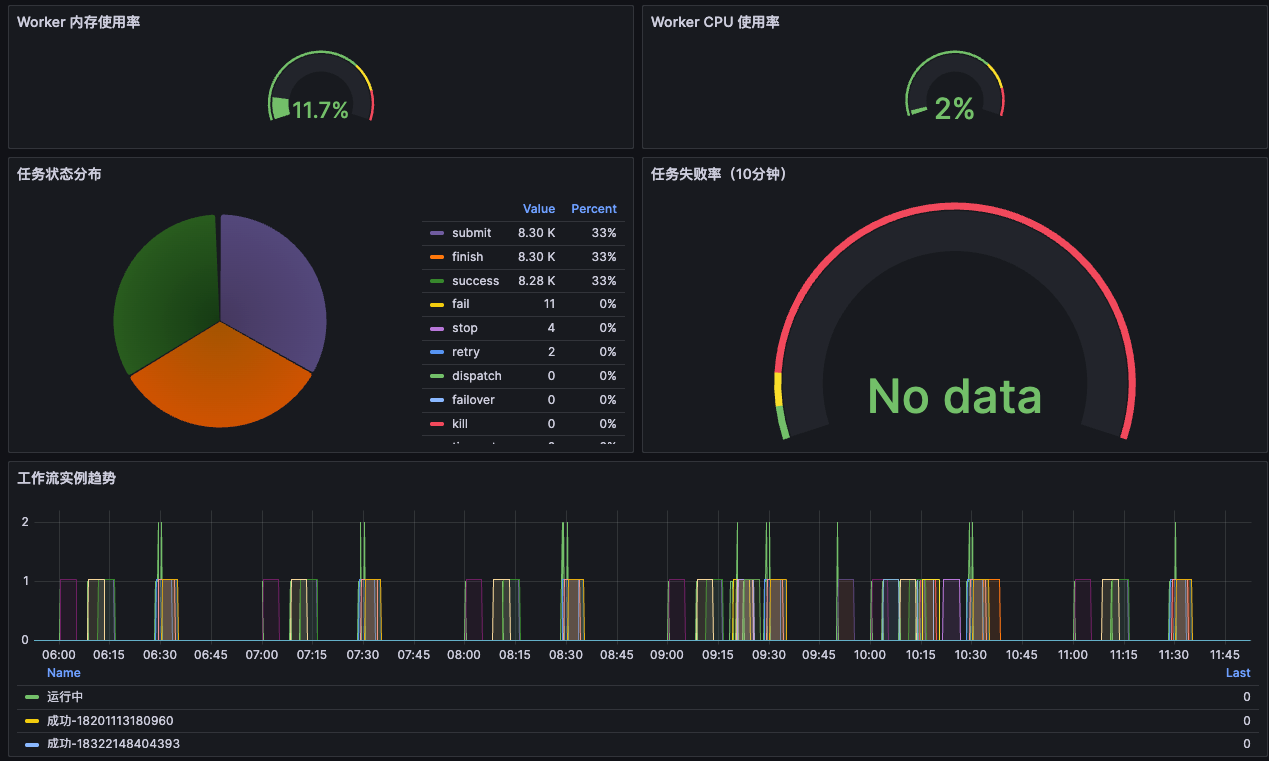
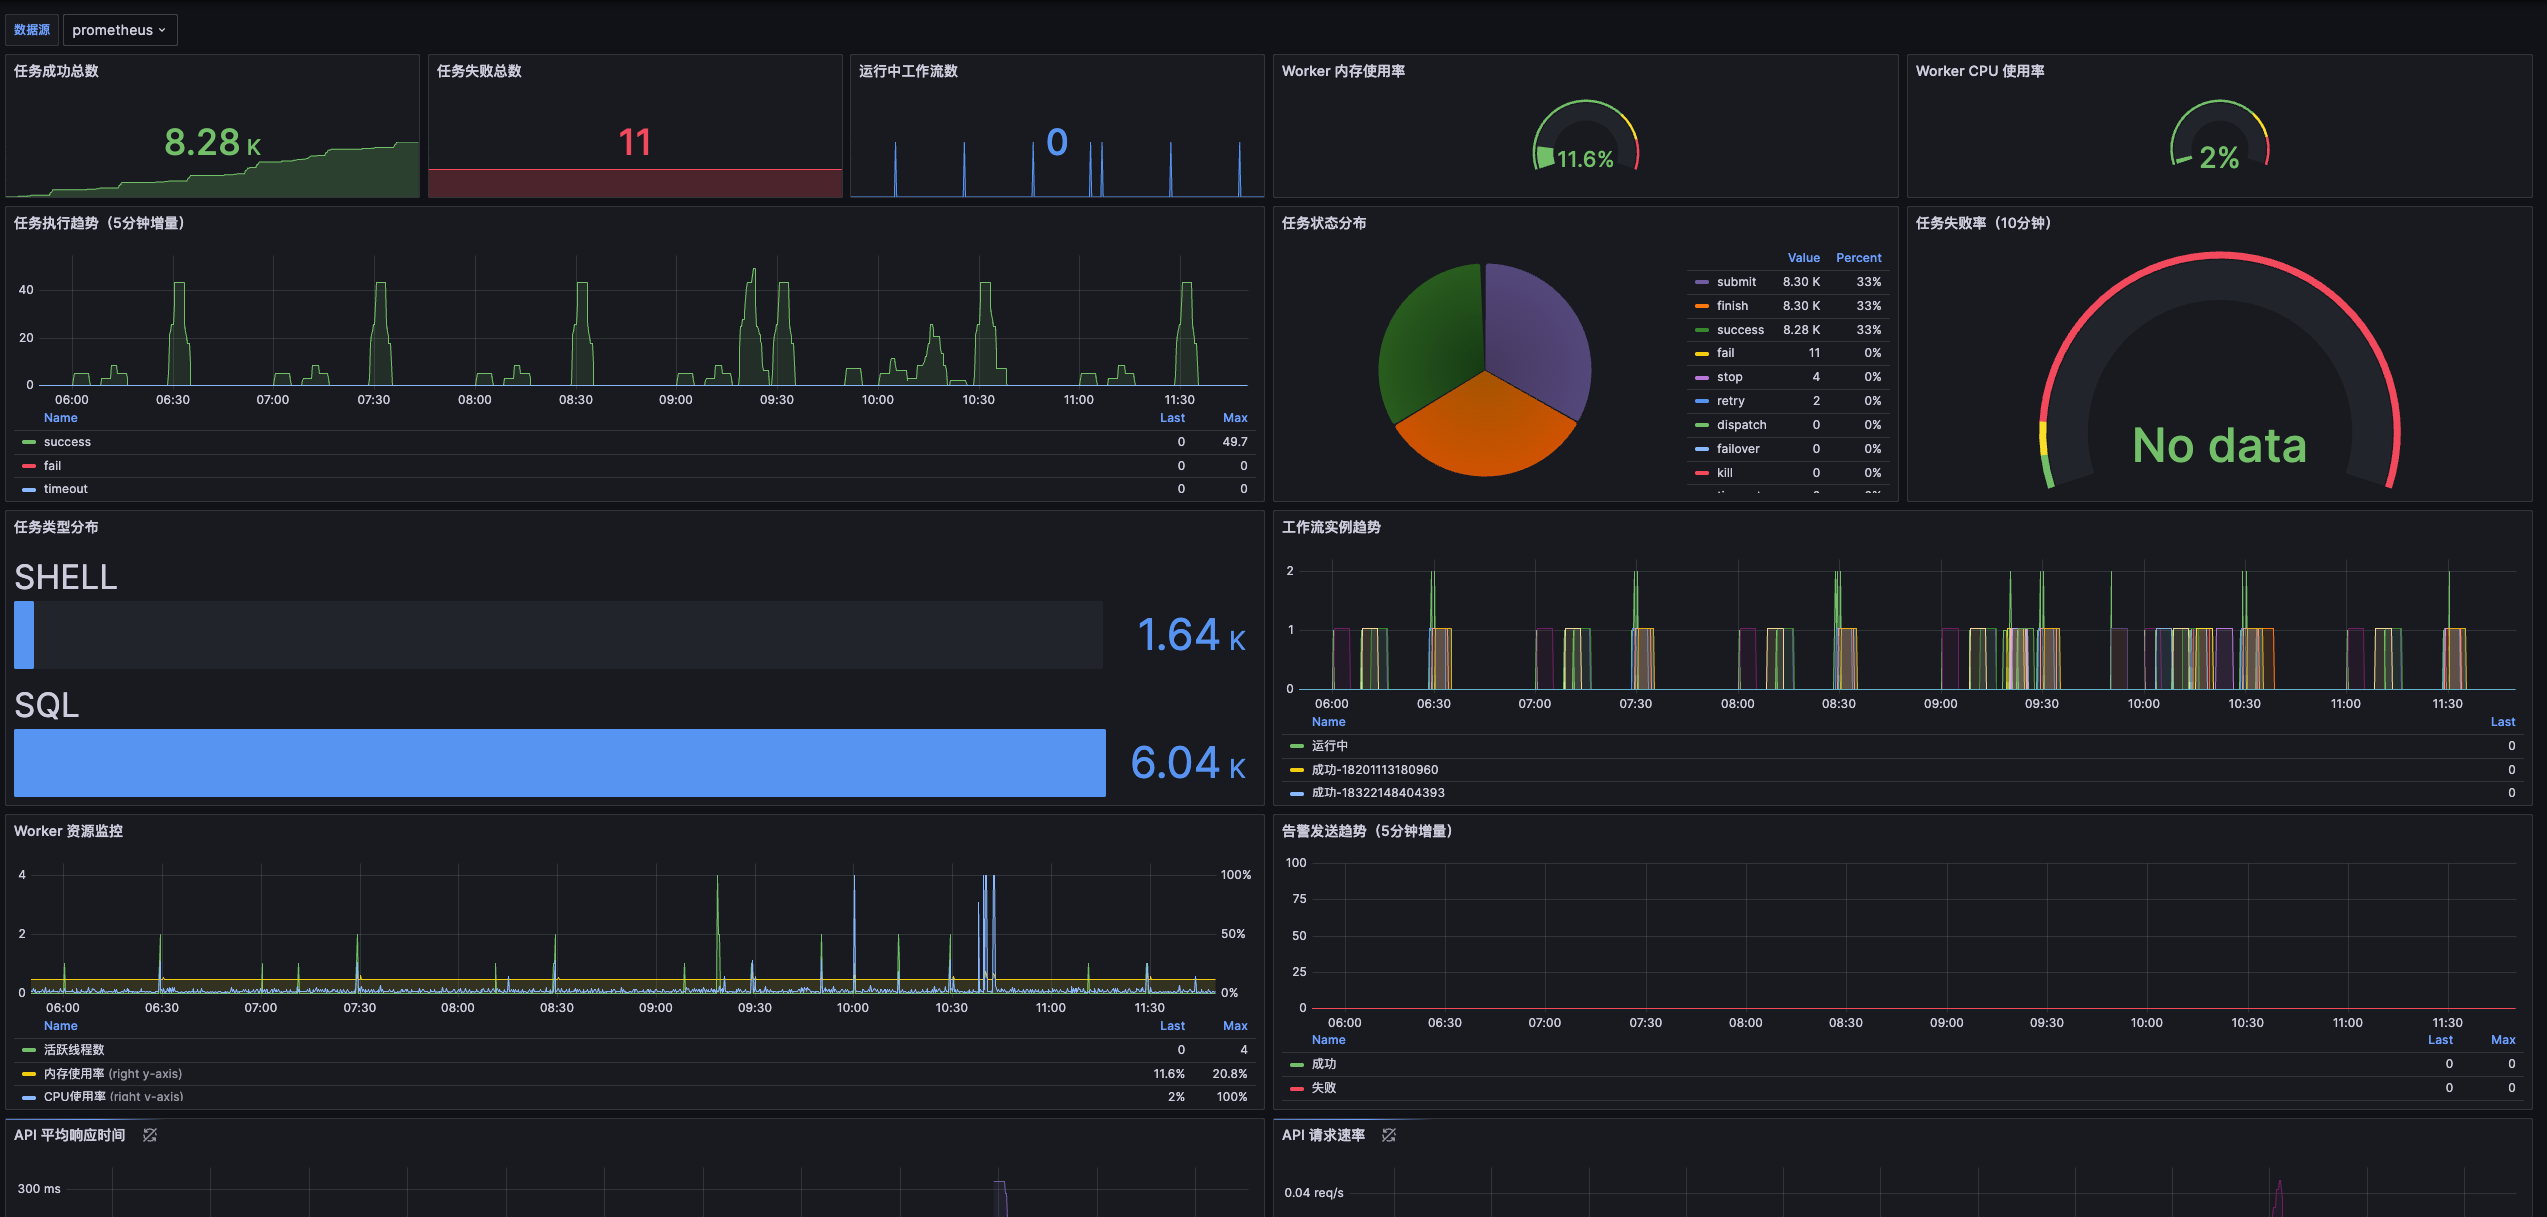
Comprehensive monitoring dashboard for Apache DolphinScheduler workflow scheduling system. Includes task execution metrics, workflow status, worker resources, and API performance monitoring.
Collector Setup
Overview
This dashboard uses DolphinScheduler's built-in Prometheus metrics exporter (via Spring Boot Actuator). No additional collector agent is required.
Step 1: Enable DolphinScheduler Metrics
Add the following configuration to DolphinScheduler's application.yaml:
management:
  endpoints:
    web:
      exposure:
        include: '*'
  metrics:
    export:
      prometheus:
        enabled: true
Data source config
Collector type:
Collector plugins:
Collector config:
Revisions
Upload an updated version of an exported dashboard.json file from Grafana
| Revision | Description | Created | |
|---|---|---|---|
| Download |