vLLM Monitoring - V2
vLLM 추론 서버 모니터링
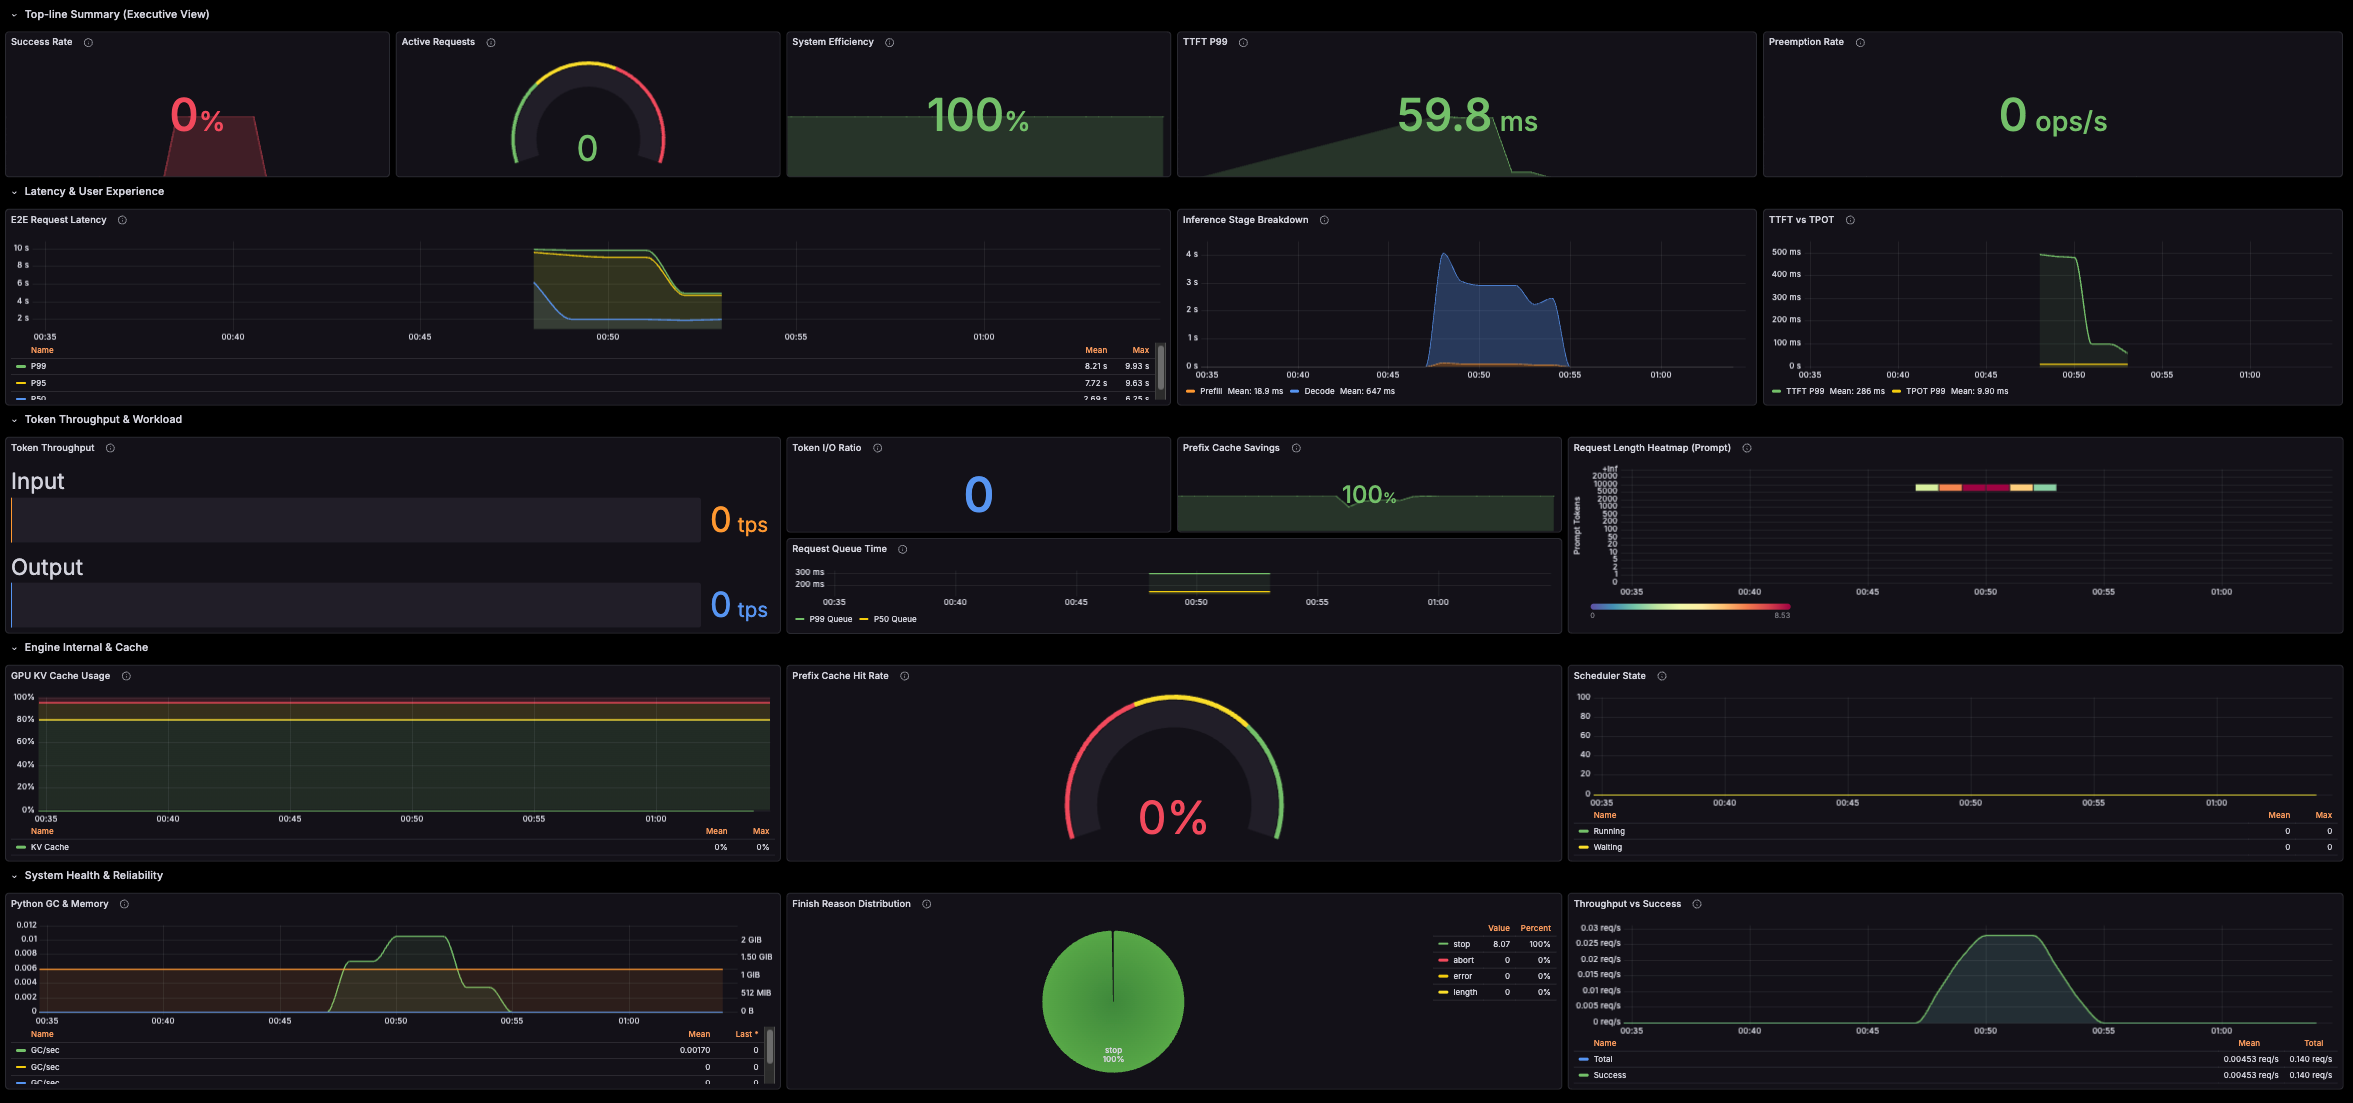
The vLLM Monitoring - V2 dashboard uses the prometheus data source to create a Grafana dashboard with the bargauge, gauge, heatmap, piechart, stat and timeseries panels.
Data source config
Collector type:
Collector plugins:
Collector config:
Revisions
Upload an updated version of an exported dashboard.json file from Grafana
| Revision | Description | Created | |
|---|---|---|---|
| Download |