Gemini CLI (VictoriaStack)
Dashboard for Google Gemini CLI with information about token usage and token cache, tools usage stats and latency, mcp servers stats, added/removed lines of code, API requests and errors, etc...
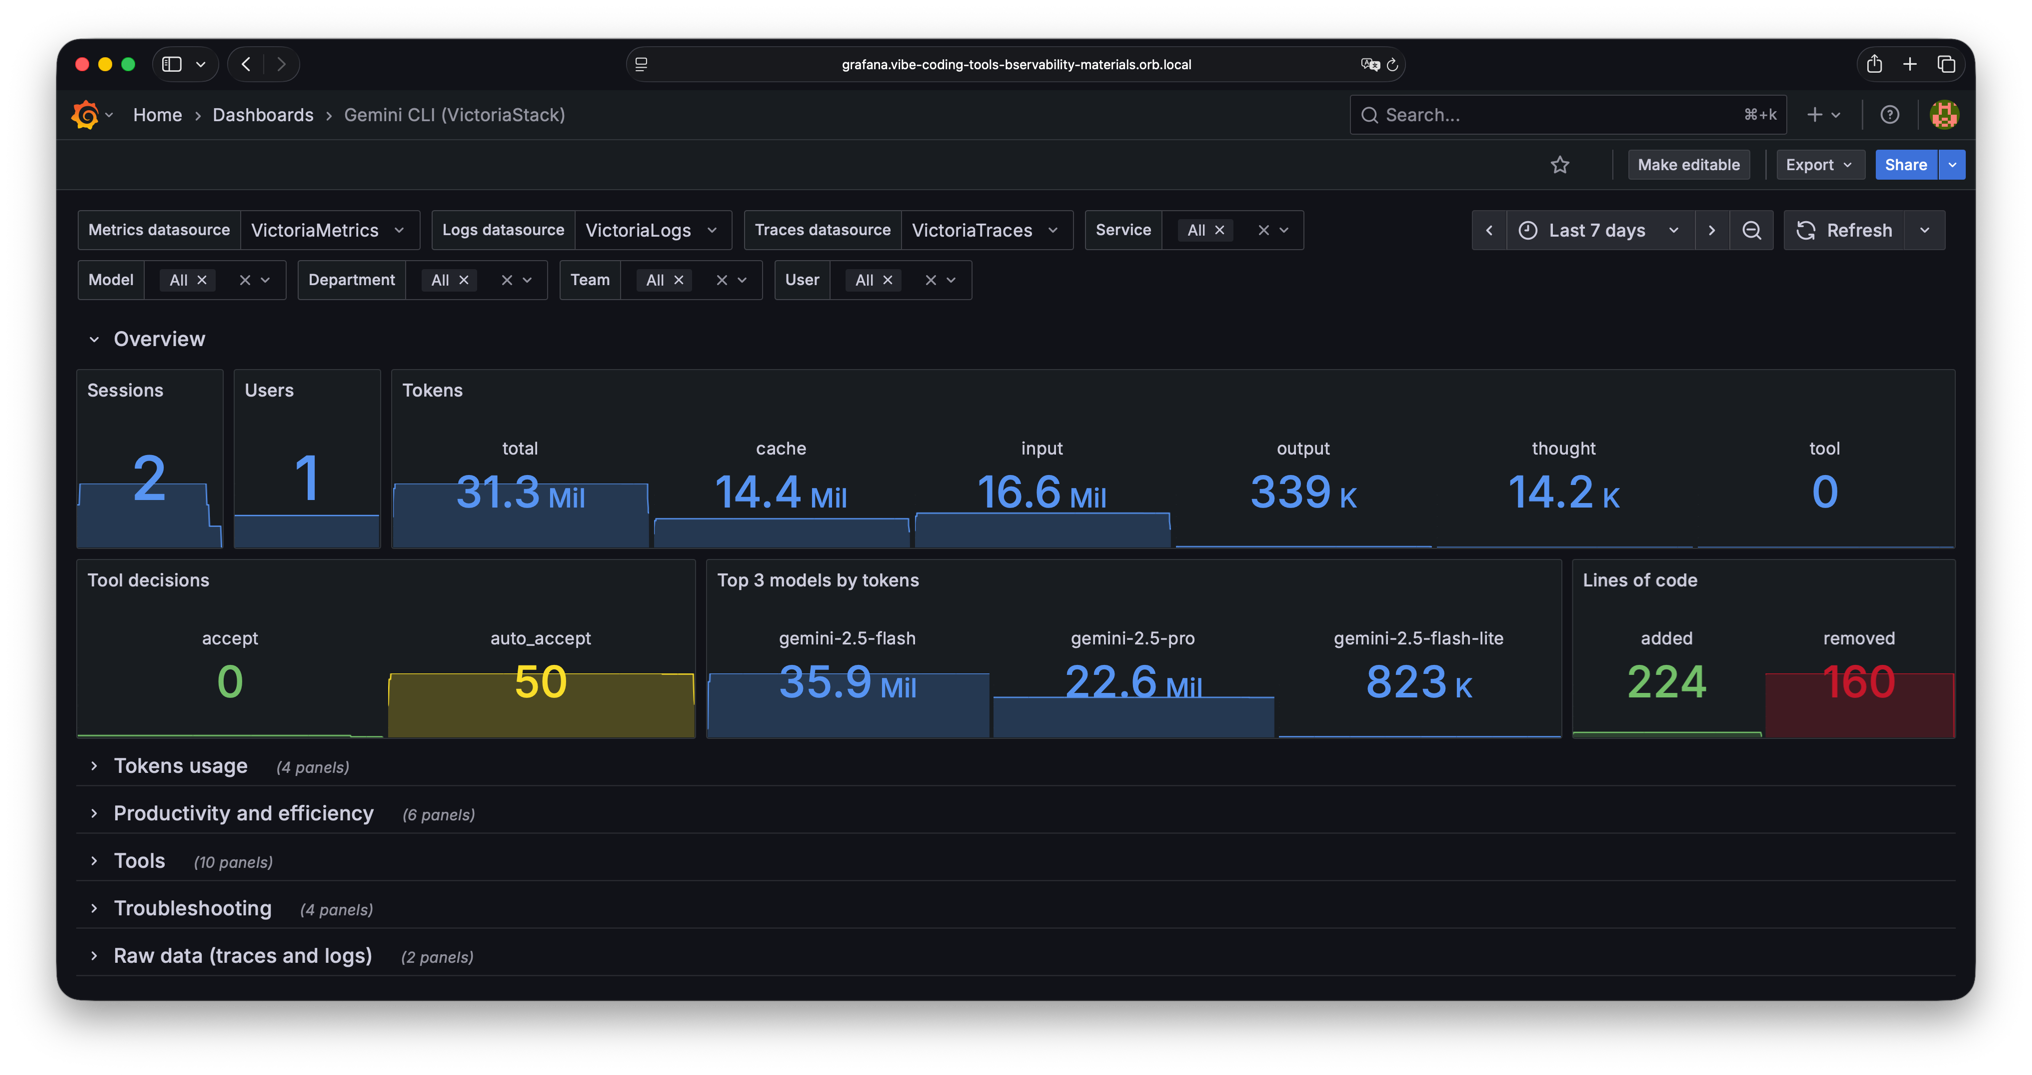
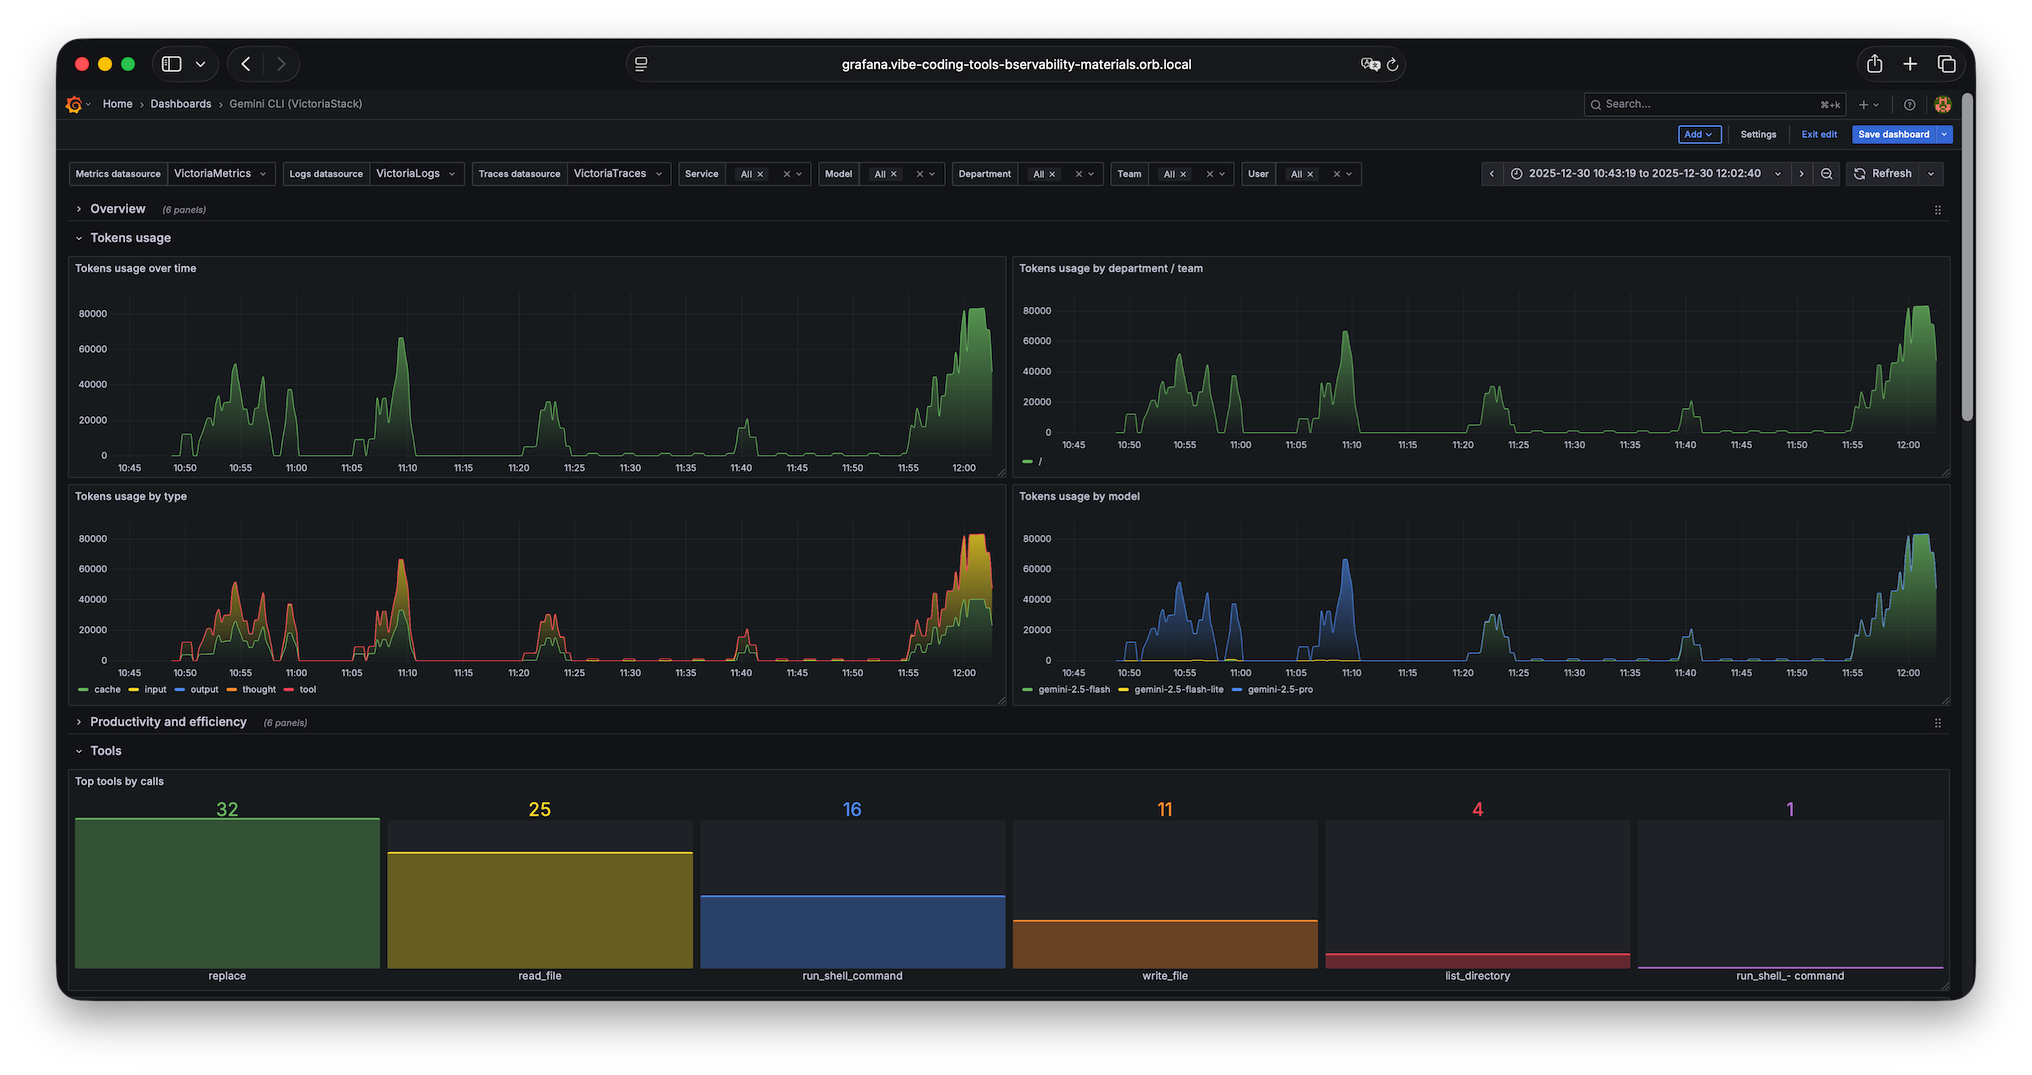
The Gemini CLI (VictoriaStack) dashboard uses the jaeger, victoriametrics-logs-datasource and victoriametrics-metrics-datasource data sources to create a Grafana dashboard with the barchart, bargauge, logs, stat, table and timeseries panels.
Data source config
Collector type:
Collector plugins:
Collector config:
Revisions
Upload an updated version of an exported dashboard.json file from Grafana
| Revision | Description | Created | |
|---|---|---|---|
| Download |