Host Metrics (opentelemetry)
Monitor host performance using OpenTelemetry Collector's hostmetrics receiver. Includes CPU utilization, system load, memory usage, disk I/O throughput/IOPS, filesystem utilization, and network traffic. Features flexible host label filtering for Kubernetes or standalone deployments. Requirements: OpenTelemetry Collector with hostmetrics receiver (cpu, disk, load, filesystem, memory, network scrapers) exporting to Prometheus with UnderscoreEscapingWithSuffixes translation strategy.
Host Metrics Dashboard (OpenTelemetry)
Monitor host performance using OpenTelemetry Collector's hostmetrics receiver.
Requirements
- OpenTelemetry Collector with hostmetrics receiver
- Prometheus with OTLP ingestion enabled
- Prometheus translation strategy:
UnderscoreEscapingWithSuffixes
Required Scrapers
receivers:
  hostmetrics:
    collection_interval: 30s
    scrapers:
      cpu: {}
      disk: {}
      load: {}
      filesystem: {}
      memory: {}
      network: {}
Template Variables
| Variable | Description |
|---|---|
DS_PROMETHEUS | Prometheus datasource |
host_label | Label for host identification (k8s_node_name or host) |
host | Host value to filter |
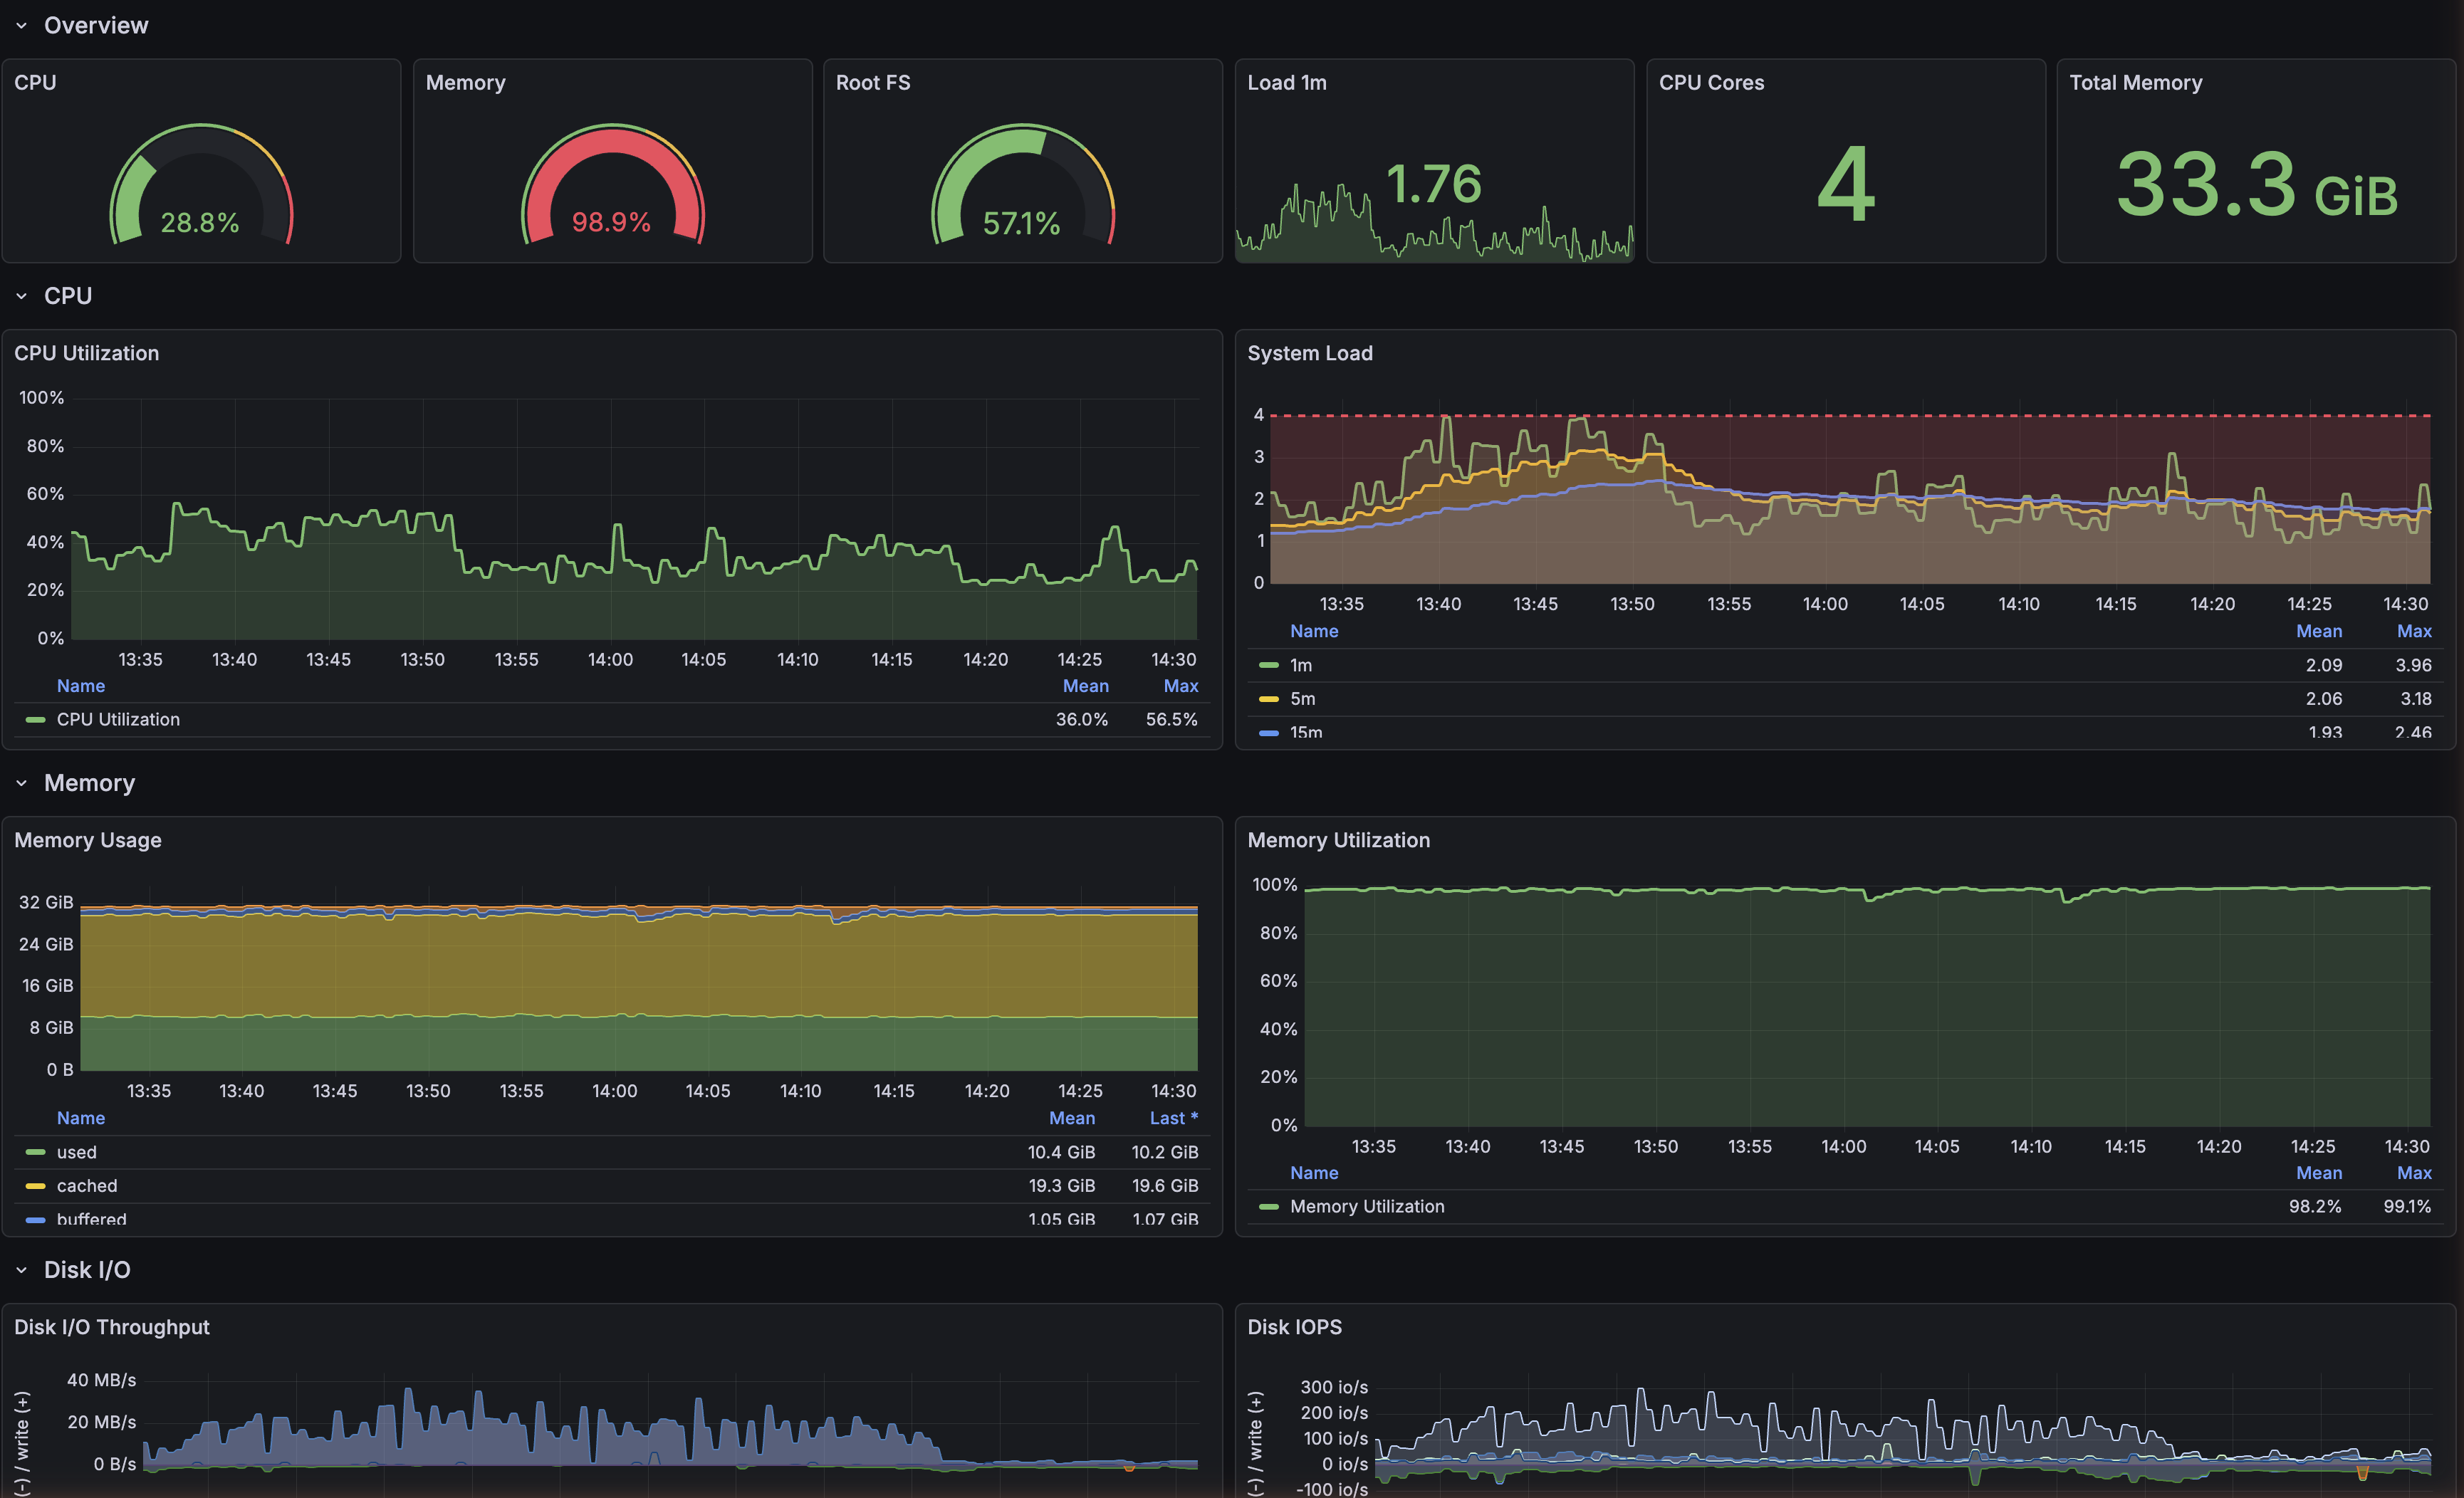
Panels
Overview
- CPU / Memory / Root FS utilization gauges
- Load 1m, CPU Cores, Total Memory stats
CPU
- CPU Utilization over time
- System Load (1m/5m/15m with cores reference line)
Memory
- Memory Usage breakdown (used/cached/buffered/free)
- Memory Utilization over time
Disk I/O
- Throughput (read/write mirrored)
- IOPS (read/write mirrored)
- Disk Busy %
Filesystem
- Utilization by mountpoint (bar gauge)
- Usage over time
Network
- Throughput in bps (rx/tx mirrored)
- Packets per second (rx/tx mirrored)
- Network Errors
- TCP Connections by state
Metrics Reference
| Metric | Type | Description |
|---|---|---|
system_cpu_time_seconds_total | counter | CPU time by state |
system_cpu_load_average_1m/5m/15m | gauge | System load averages |
system_memory_usage_bytes | gauge | Memory by state |
system_disk_io_bytes_total | counter | Disk throughput |
system_disk_operations_total | counter | Disk IOPS |
system_disk_io_time_seconds_total | counter | Disk busy time |
system_filesystem_usage_bytes | gauge | Filesystem usage |
system_network_io_bytes_total | counter | Network throughput |
system_network_packets_total | counter | Network packets |
system_network_errors_total | counter | Network errors |
system_network_connections | gauge | TCP connections |
Data source config
Collector type:
Collector plugins:
Collector config:
Revisions
Upload an updated version of an exported dashboard.json file from Grafana
| Revision | Description | Created | |
|---|---|---|---|
| Download |