Traefik Opentelemetry
Full guide - https://medium.com/@appletimedk/traefik-opentelemetry-otlp-grafana-otel-lgtm-stack-2f3aaec96624
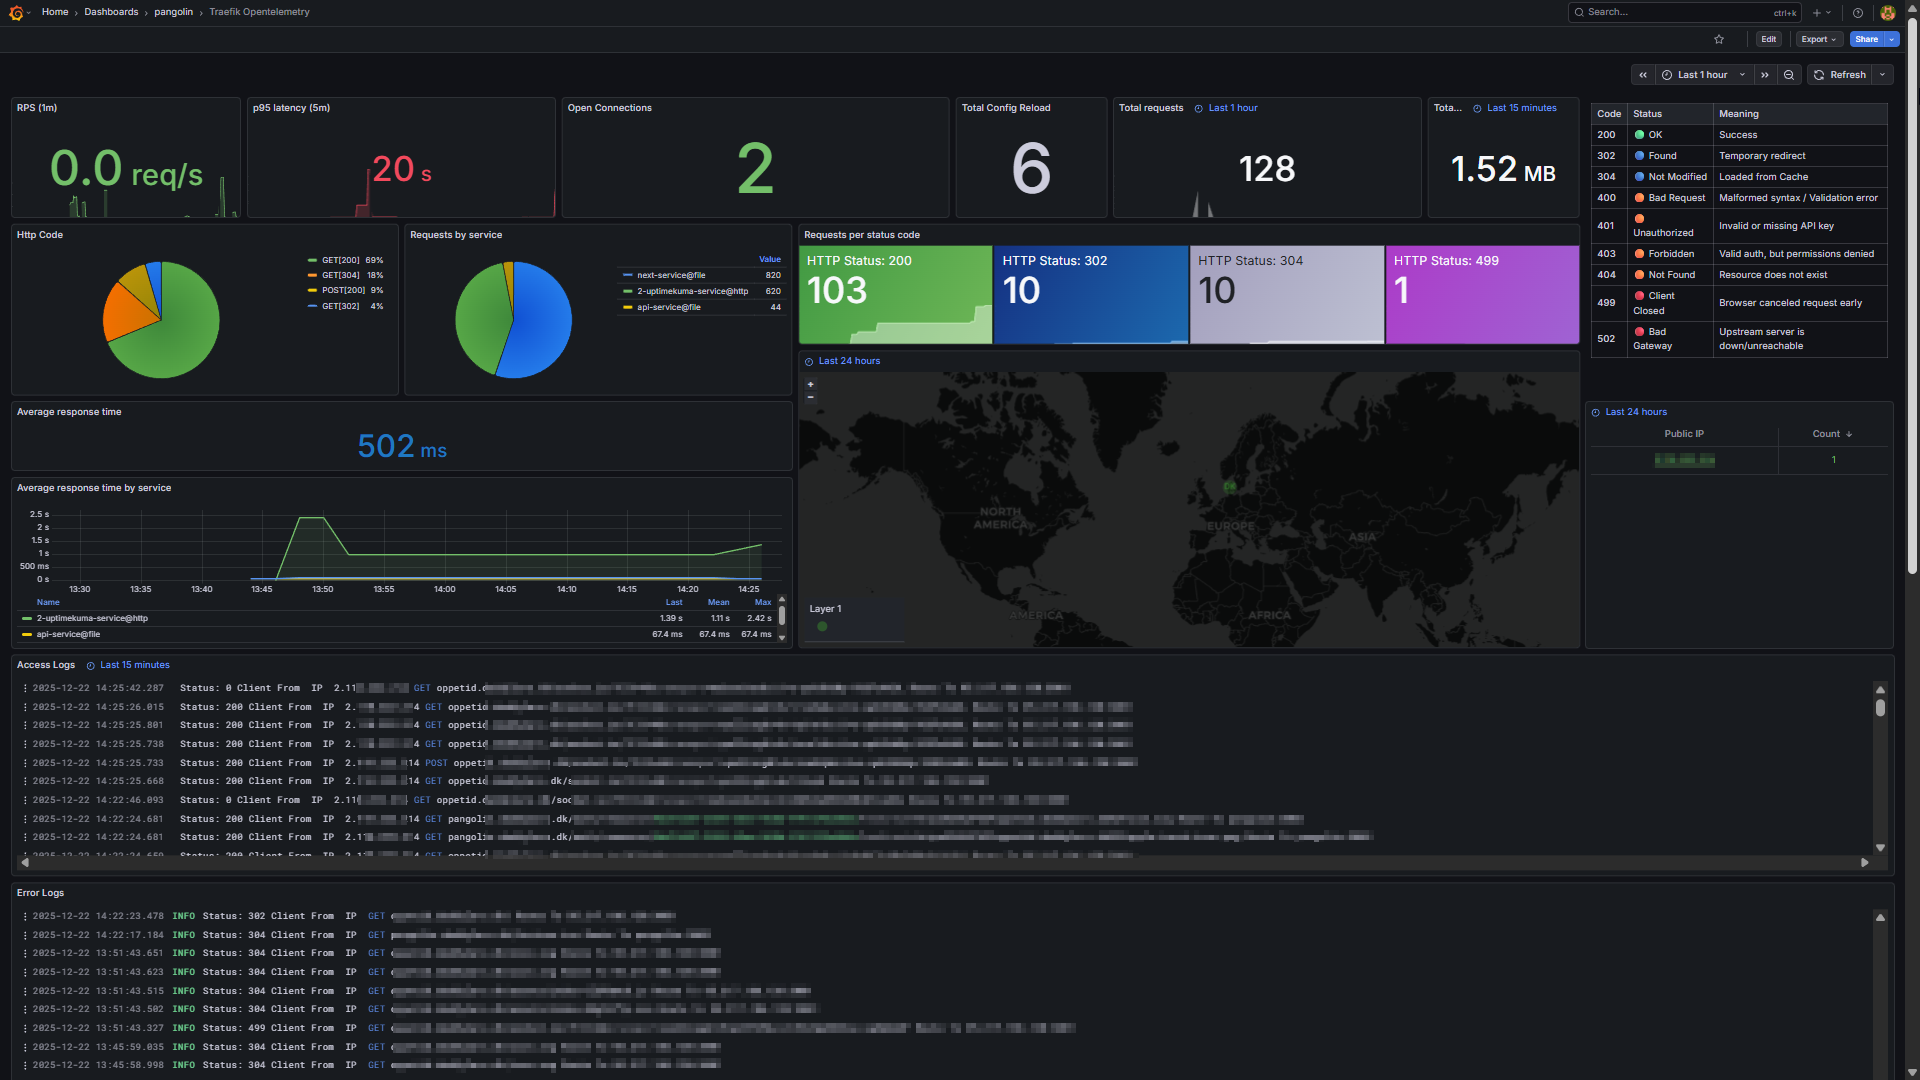
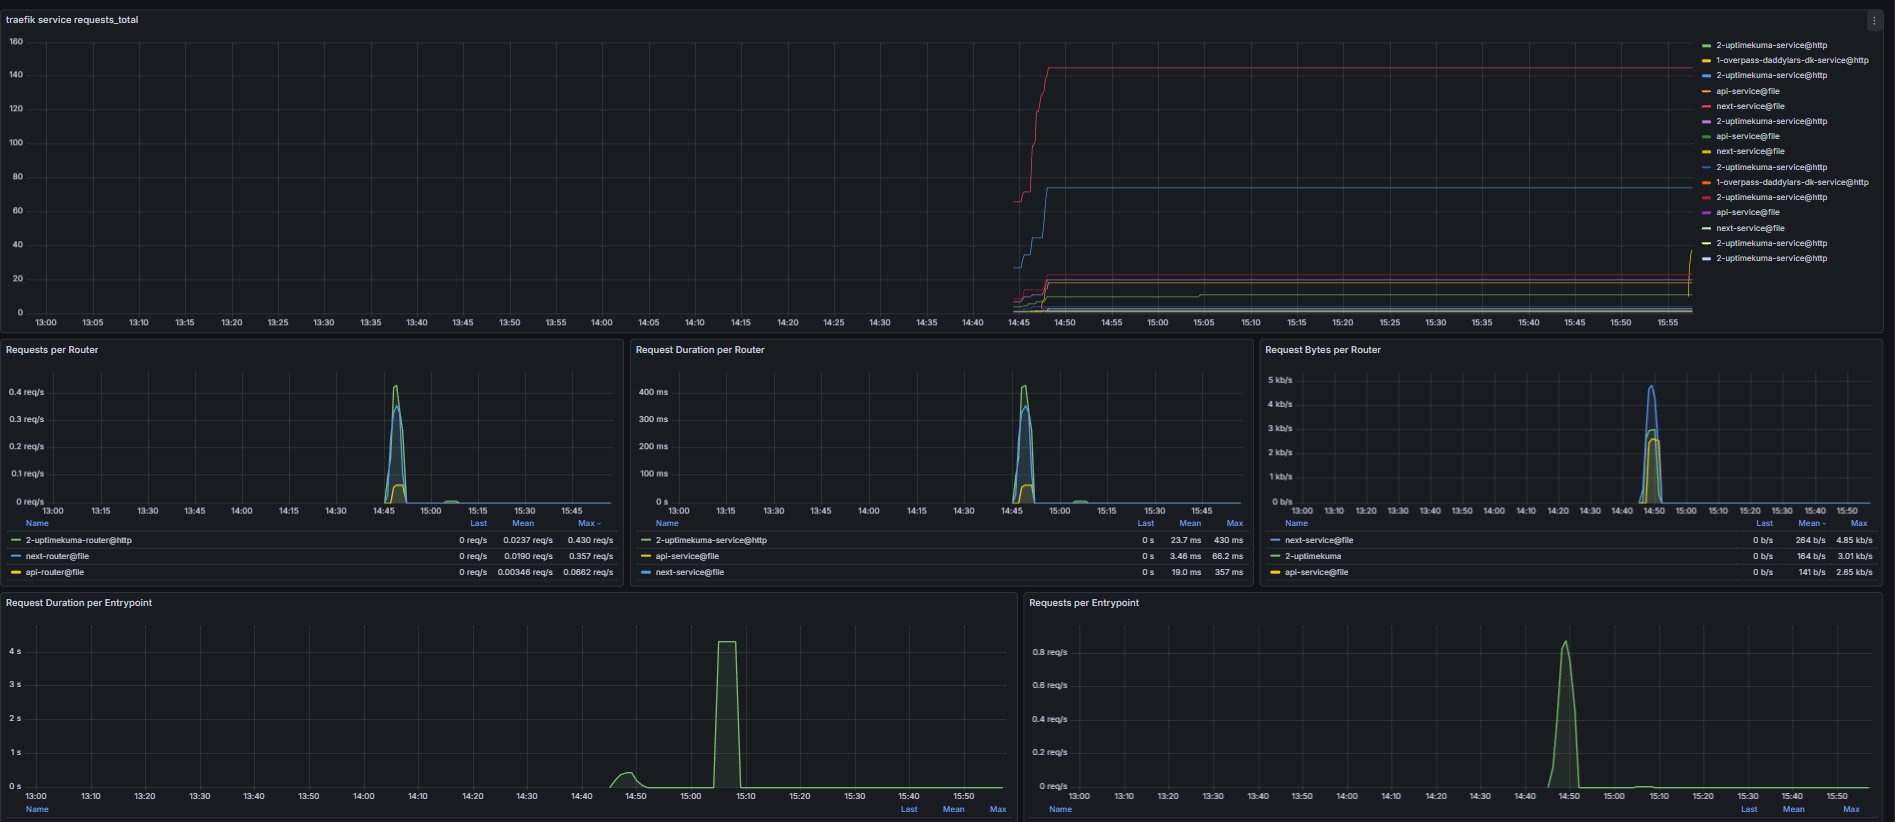
The Traefik Opentelemetry dashboard uses the loki and prometheus data sources to create a Grafana dashboard with the geomap, logs, piechart, stat, table, text and timeseries panels.
Data source config
Collector type:
Collector plugins:
Collector config:
Revisions
Upload an updated version of an exported dashboard.json file from Grafana
| Revision | Description | Created | |
|---|---|---|---|
| Download |
Traefik
Easily monitor Traefik, the dynamic load balancer, with Grafana Cloud's out-of-the-box monitoring solution.
Learn more