Kafka Metrics Dashboard (Kafka Exporter)
A comprehensive Kafka monitoring dashboard for Kubernetes. Visualizes Consumer Lag, Throughput, and Broker Health using Kafka Exporter and cAdvisor.
Kafka Premium Dashboard
A modern, high-performance Grafana dashboard for monitoring Apache Kafka on Kubernetes. This dashboard focuses on Consumer Lag and Cluster Health without relying on complex JMX configurations.
🌟 Features
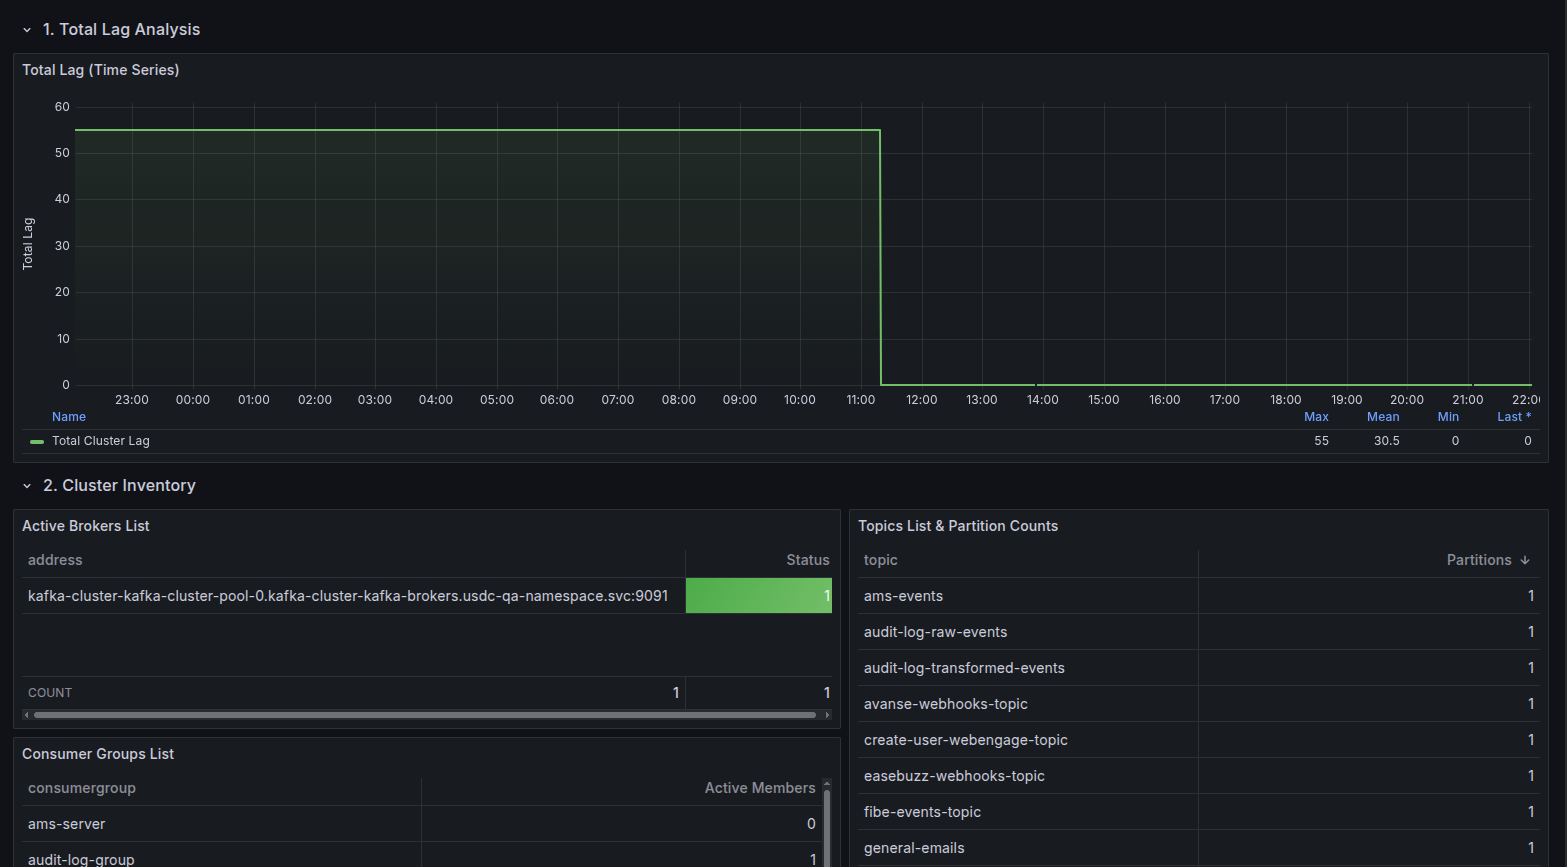
- Cluster Inventory: Instant view of active Brokers, Topics, and Consumer Groups with identity details.
- Lag Analysis:
- Total Cluster Lag: Time-series visualization of global backlog.
- Per-Group Lag: Detailed breakdown of lag per consumer group with Min/Max/Mean stats.
- Top Offenders: "Top 10 Lagging Groups" table to instantly spot bottlenecks.
- Throughput Metrics: Real-time Messages In/Sec (Production) and Messages Out/Sec (Consumption) rates.
- Deep Dive Tables:
- Topic Offsets: View current High Watermark offsets per partition.
- Consumer Offsets: View committed offsets per group/partition.
- Infrastructure Health: CPU, Memory, and Network I/O usage per Broker pod (via cAdvisor).
- Namespace Filtering: Built-in variable to filter resources by Kubernetes Namespace.
📋 Requirements
- Prometheus Datasource.
- Kafka Exporter (e.g.,
danielqsj/kafka-exporter) deployed in your cluster. - Kubernetes environment (for CPU/Memory metrics).
🔧 Setup
- Deploy Kafka Exporter: Ensure
kafka-exporteris running and pointing to your Kafka brokers. - Import Dashboard:
- Copy the JSON ID or upload the JSON file.
- Select your Prometheus datasource when prompted.
- Select Namespace: Use the dropdown at the top to select your Kafka namespace.
📸 Panels Overview
| Section | Description |
|---|---|
| Total Lag Analysis | Aggregate lag across all consumer groups. Best for spotting cluster-wide issues. |
| Cluster Inventory | Tables listing Broker IDs, Topic names (with partition counts), and Consumer Groups. |
| Throughput | Production vs. Consumption rates to analyze traffic flow. |
| Offsets & Partitions | Detailed tables showing the exact offset position for every partition. |
| Infrastructure | (Collapsed by default) CPU/Memory/Network usage per broker pod. |
Data source config
Collector type:
Collector plugins:
Collector config:
Revisions
Upload an updated version of an exported dashboard.json file from Grafana
| Revision | Description | Created | |
|---|---|---|---|
| Download |
Kafka
Easily monitor your Kafka deployment with Grafana Cloud's out-of-the-box monitoring solution.
Learn more