
EXAScaler Overview
The EXAScaler Overview dashboard provides a unified, real-time view of filesystem health and performance across MDS, OSS, clients, and networking layers. It highlights critical KPIs such as IOPS, throughput, latency, MDT/OST capacity, LNet traffic, job activity, and cluster resource utilization. This dashboard enables quick detection of bottlenecks, anomaly patterns, and imbalances across the Lustre stack, helping administrators troubleshoot faster and maintain optimal system performance.


EXAScaler Overview Dashboard
This dashboard provides a complete operational view of DDN EXAScaler (Lustre) performance and health. It visualizes node-level system metrics, filesystem behavior, metadata activity, and IO patterns across MDS, OSS, and client nodes — helping administrators quickly diagnose performance issues, imbalance, or bottlenecks.
What This Dashboard Shows
Node System Metrics
- Panels derived from node_cpu_seconds_total and memory metrics:
- CPU Usage (user, system, iowait, etc.)
- Memory Usage (used, cached, buffer, slab, free)
- These provide a baseline view of node saturation and hardware utilization.
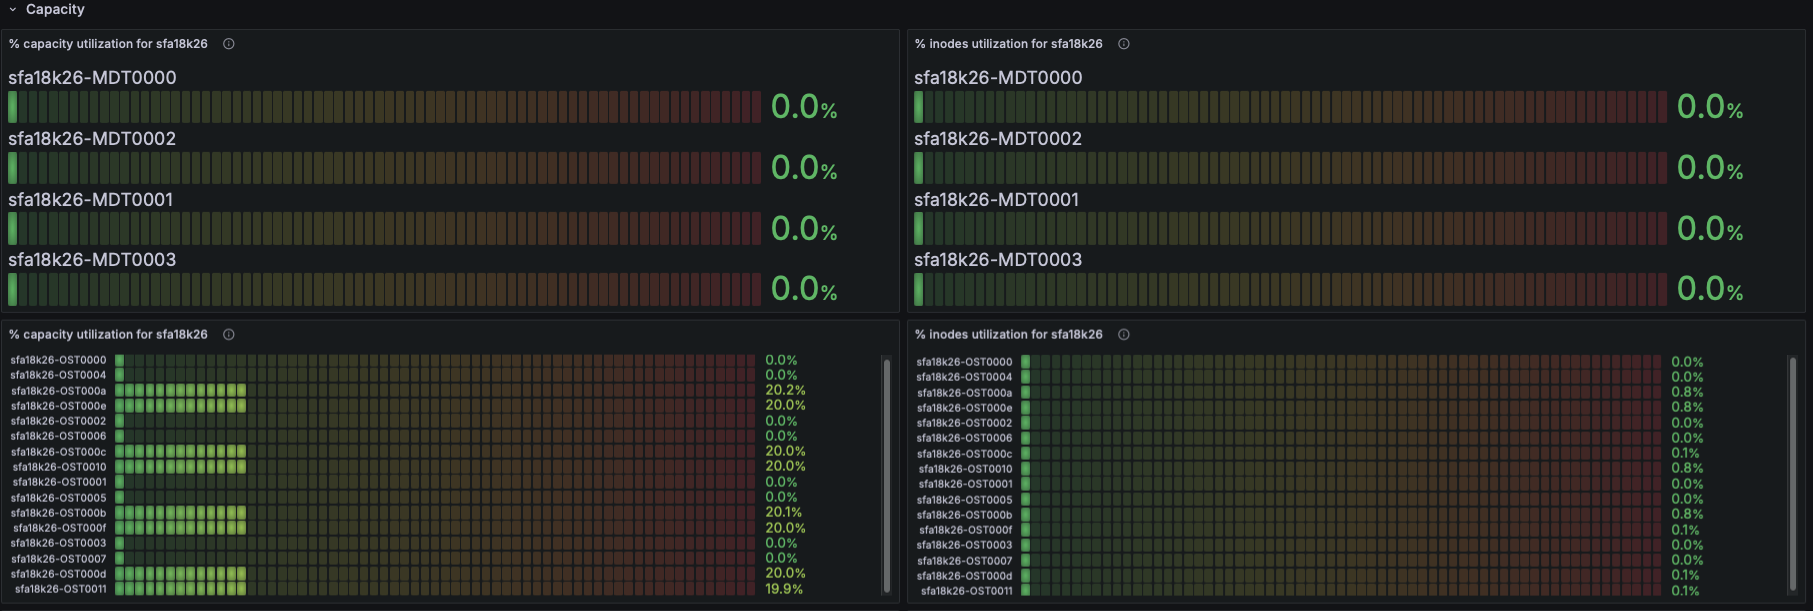
Filesystem Status
- Using Lustre exporter metrics:
- Number of exported targets for the filesystem
- Number of connected clients
- This indicates cluster size, active nodes, and connectivity health.
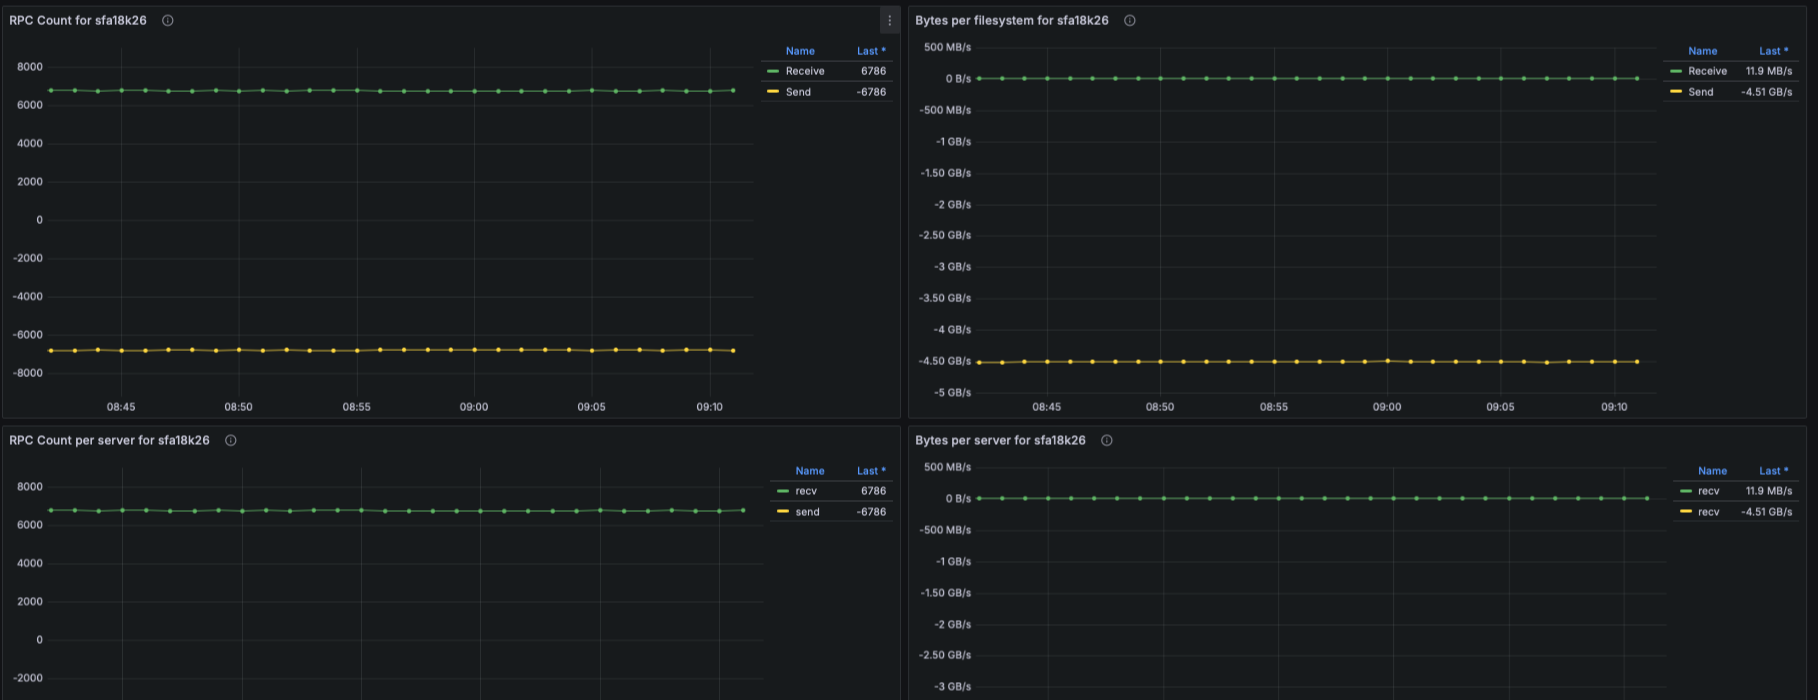
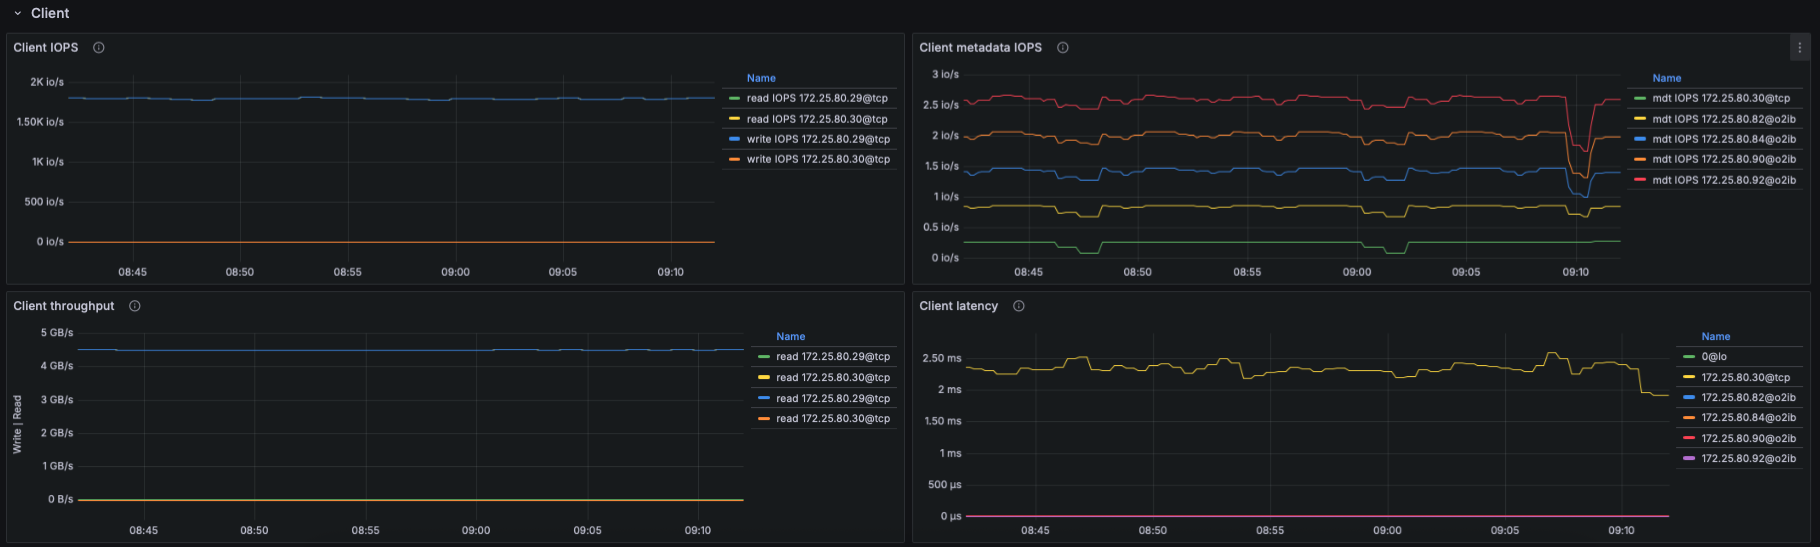
IO Throughput
- Panels show aggregated and per-target throughput using:
- lustre_read_bytes_total
- lustre_write_bytes_total
- Metrics include:
- Aggregate filesystem throughput (read/write)
- Throughput per OST
- Metadata throughput (MDT reads/writes)
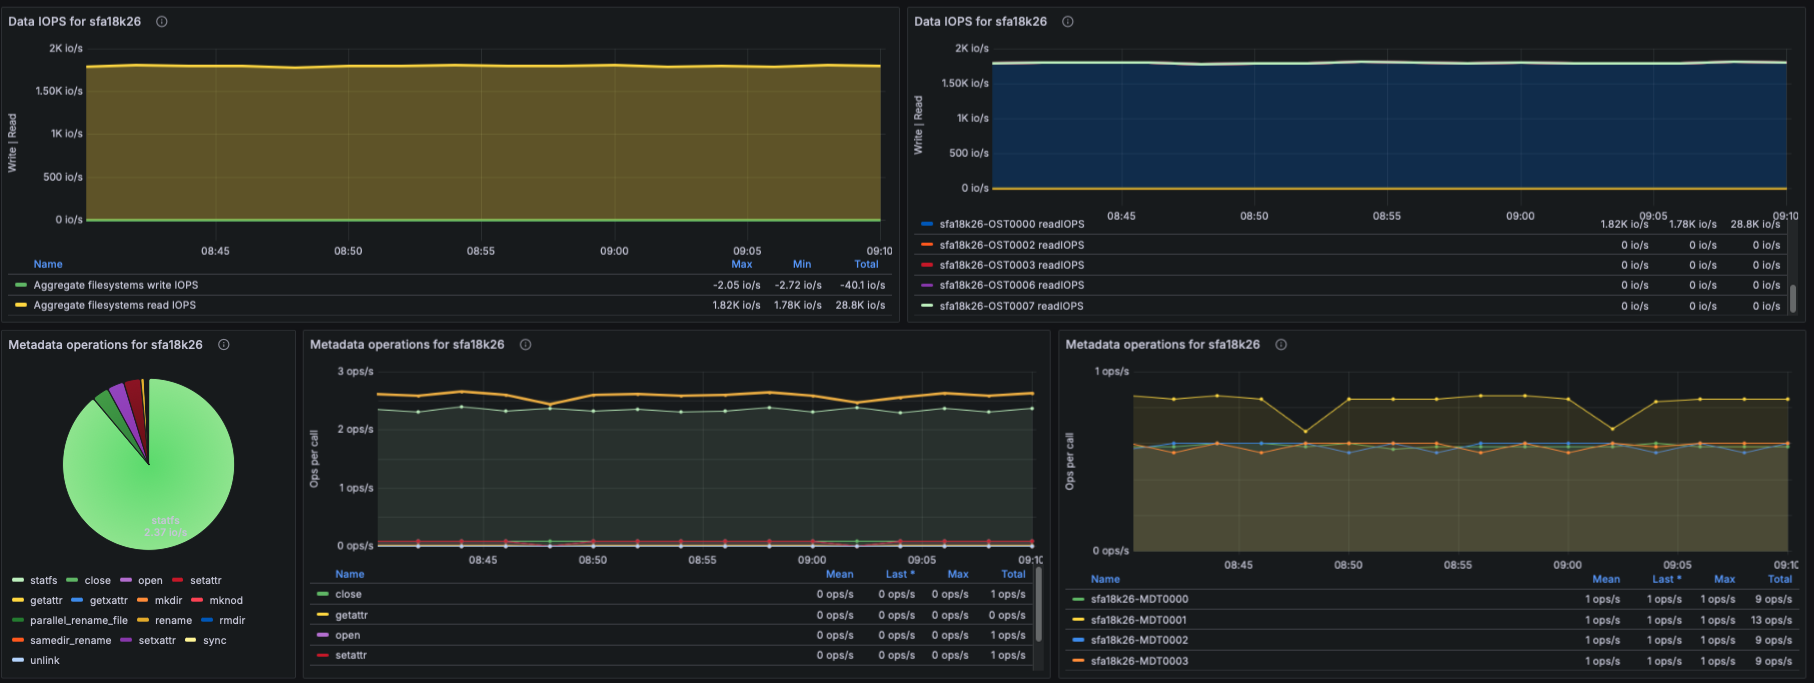
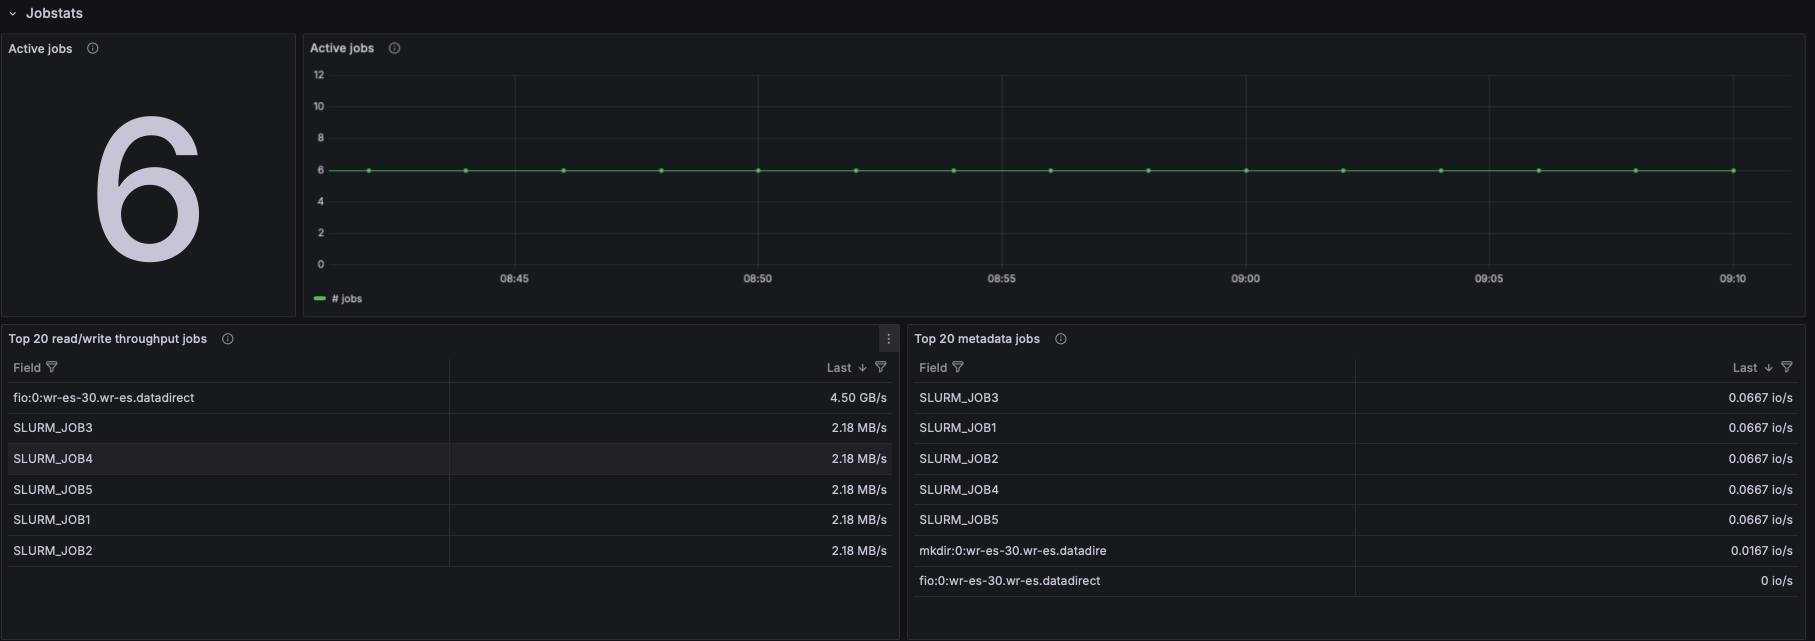
IOPS
- Using lustre_read_samples_total / lustre_write_samples_total:
- Aggregate data IOPS
- IOPS per OST
- Understanding which targets receive the highest IO pressure.
Metadata Operations
- Based on lustre_stats_total:
- Metadata ops by operation type (lookup, getattr, setattr, create, unlink, etc.)
- Metadata ops trend panel
- Metadata ops per-target
- This helps identify whether metadata-heavy workloads are causing bottlenecks.
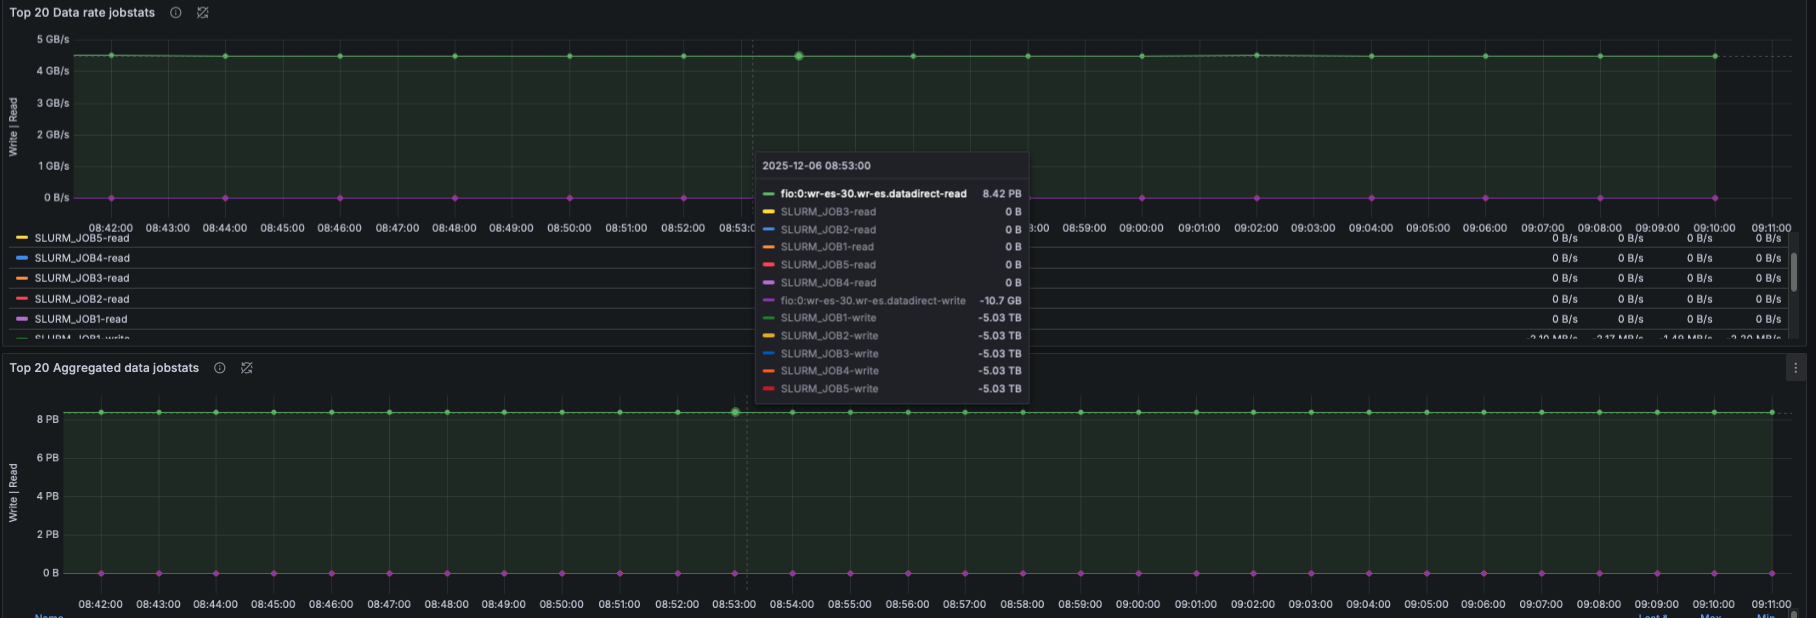
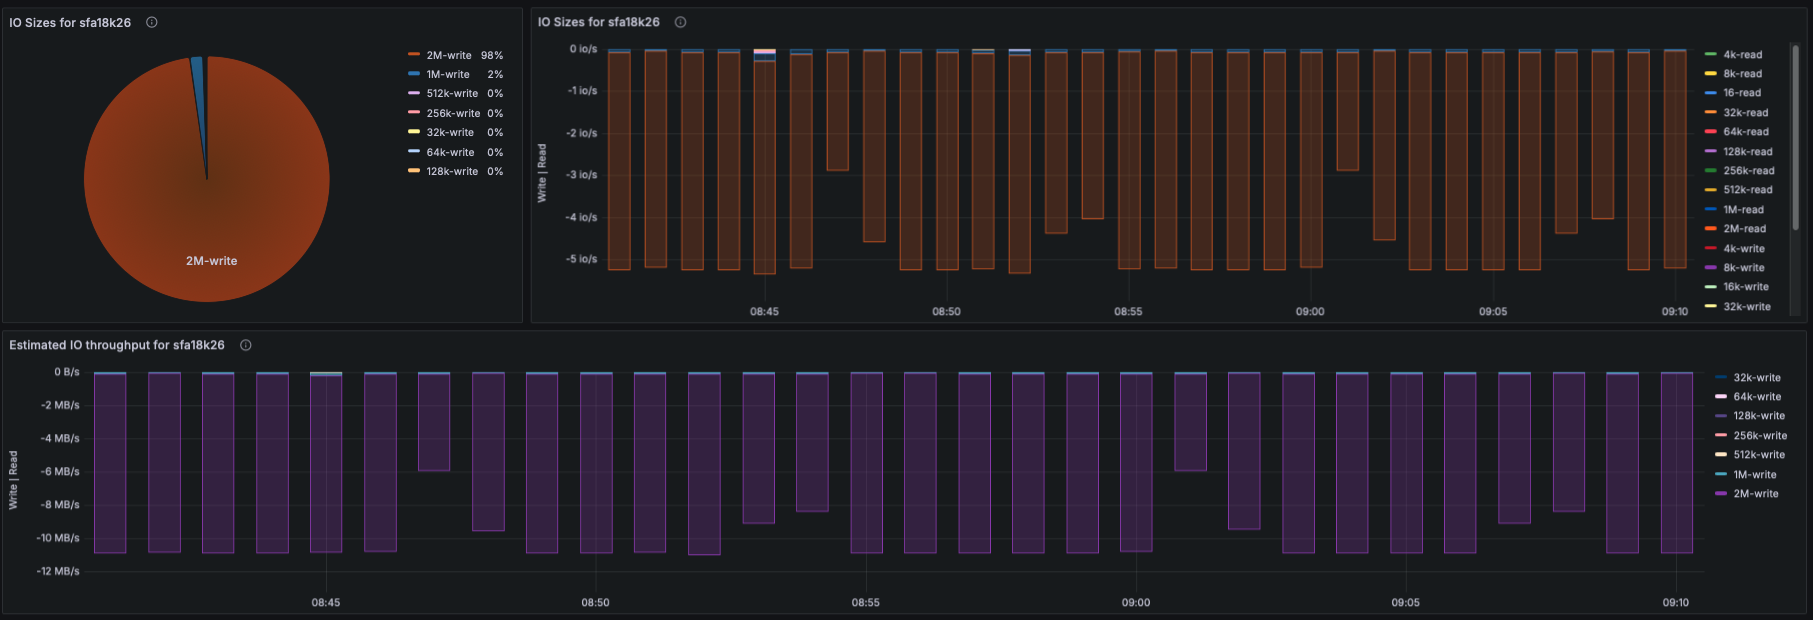
IO Size Distribution
- Using lustre_disk_io_total:
- Pie-chart of read/write IO sizes
- Time-series view of IO size distribution
- This captures workload patterns (small IO, streaming IO, mixed IO).
How Metrics Are Collected
- Metrics for this dashboard are collected using:
- OpenTelemetry Collector
- Configured with a Prometheus receiver to scrape:
- Node Exporter (CPU/memory)
- Lustre Exporter (Lustre OSS/MDS/Client metrics)
Notes
- This dashboard is parameterized to support multiple EXAScaler clusters and filesystems via $cluster and $filesystemvariables.
- All queries use PromQL and are compatible with any Prometheus remote-read endpoint.
- Logs, traces, and alerting integrate with OTEL in future phases of EXAScaler Observability.
Data source config
Collector config:
Upload an updated version of an exported dashboard.json file from Grafana
| Revision | Description | Created | |
|---|---|---|---|
| Download |