VictoriaLogs - vlagent
Overview for VictoriaMetrics vlagent v1.29.0 or higher
VictoriaLogs - vlagent
Requirements
vlagent: each revision may have different vlagent version requirements.
Use Prometheus datasource with this dashboard. See more details about how to configure monitoring here.
Description
This dashboard provides comprehensive monitoring, organized by functional areas:
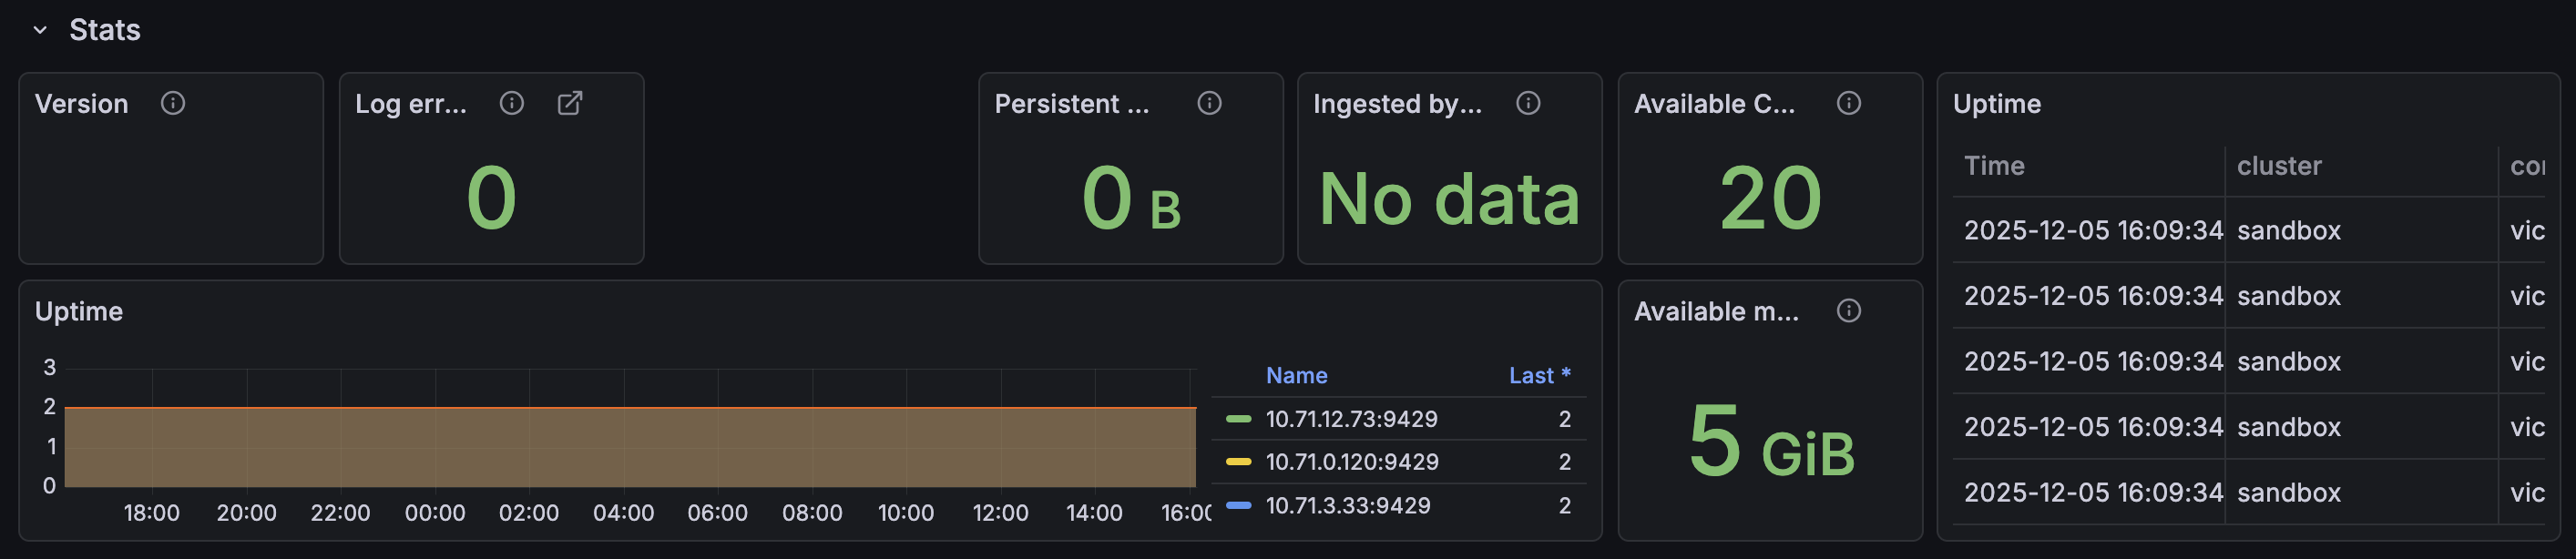
- Stats - High-level metrics including total log entries, ingestion rates, disk usage, and system version information.
- Overview - Real-time visualization of core agent metrics: log ingestion rates, request processing, error rates, and overall performance trends.
- Resource usage - Resource consumption metrics: CPU usage, memory utilization, network activity, garbage collection, and system load indicators.
- Troubleshooting - Panels for debugging and diagnostics: error tracking, configuration validation, and operational alerts.
- Ingestion - Monitoring of the log ingestion process, including flush operations and data flow rates.
- Remote write - Metrics for remote data forwarding, including request rate, open connections, and retry counts.
If you have suggestions for improvements or discover any issues, please create an issue or submit feedback through the dashboard review system.
More information about vlagent can be found in the official documentation.
New releases and container images are available on the VictoriaLogs releases page and DockerHub.
Data source config
Collector type:
Collector plugins:
Collector config:
Revisions
Upload an updated version of an exported dashboard.json file from Grafana
| Revision | Description | Created | |
|---|---|---|---|
| Download |