
n8n System Health Overview
Monitor the health of self-hosted n8n with its native Prometheus metrics: CPU, memory, heap, garbage collection, event loop latency and cluster status.
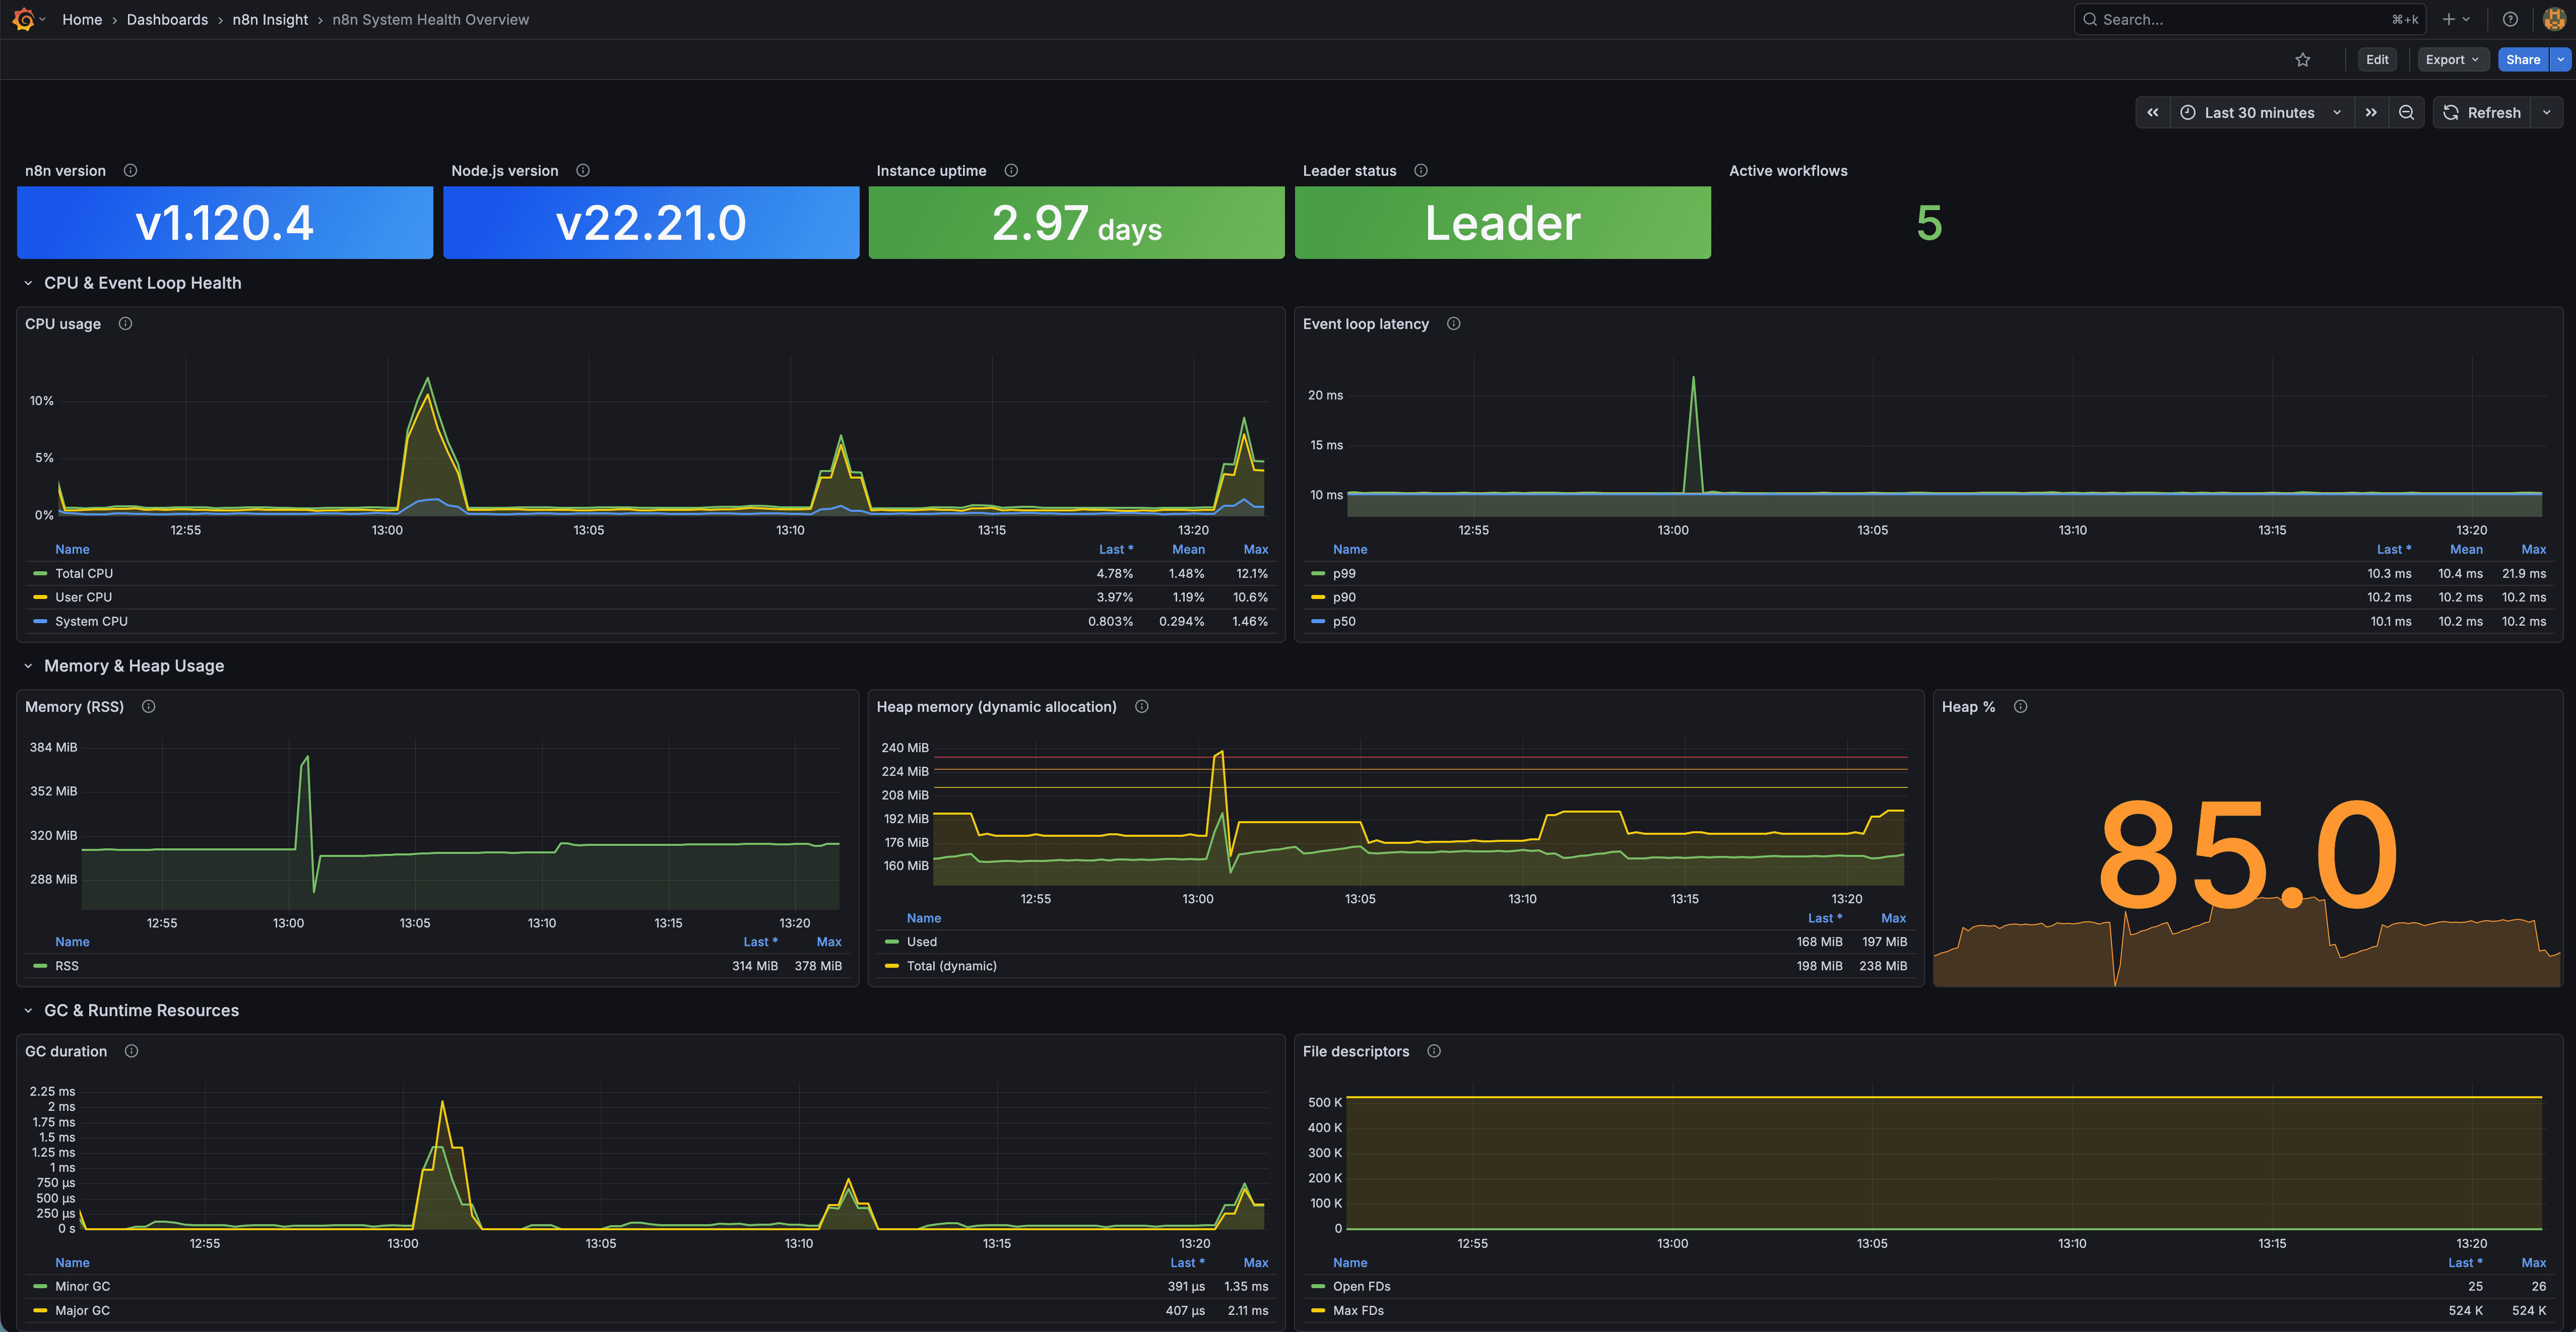
n8n System Health Overview Dashboard
A Grafana dashboard providing real-time observability into the n8n Node.js runtime, system resources, event loop health, memory usage, CPU load, and process stability via Prometheus.
Overview
This dashboard focuses on low-level system and runtime metrics from n8n's Prometheus endpoint. It gives production operators a clear view of instance health and performance.
Features
Process & Instance Information
- n8n version
- Node.js version
- Instance uptime (with thresholds)
- Leader/follower role (cluster)
- Active workflows
CPU & Event Loop Health
- CPU breakdown (total/user/system)
- Event loop latency percentiles (P50/P90/P99)
Memory & Heap Usage
- RSS memory usage
- Heap used vs total
- Heap usage percentage
Garbage Collection & Runtime
- GC duration by type
- Open file descriptors
- Max file descriptor limit
Requirements
Software
- Grafana ≥ 8
- A Prometheus data source
- Self-hosted n8n with Prometheus metrics enabled
Enable n8n Metrics
Set:
N8N_METRICS=true
Prometheus Scrape Config
scrape_configs:
  - job_name: "n8n"
    static_configs:
      - targets: ["your-n8n-instance:5678"]
    metrics_path: "/metrics"
    scrape_interval: 15s
Installation
- Go to Dashboards → New → Import
- Enter dashboard ID 24474 and click Load (or upload the JSON from this page)
- Select your Prometheus data source and click Import
Metrics Used
| Metric | Description |
|---|---|
| n8n_version_info | n8n version |
| n8n_nodejs_version_info | Node.js version |
| n8n_process_start_time_seconds | Process start time |
| n8n_instance_role_leader | Leader status |
| n8n_active_workflow_count | Active workflows |
| n8n_process_cpu_seconds_total | Total CPU |
| n8n_process_cpu_user_seconds_total | User CPU |
| n8n_process_cpu_system_seconds_total | System CPU |
| n8n_nodejs_eventloop_lag_p*_seconds | Event loop percentiles |
| n8n_process_resident_memory_bytes | RSS memory |
| n8n_nodejs_heap_size_used_bytes | Heap used |
| n8n_nodejs_heap_size_total_bytes | Heap total |
| n8n_nodejs_gc_duration_seconds_sum | GC duration |
| n8n_process_open_fds | Open file descriptors |
| n8n_process_max_fds | Max file descriptors |
Related
- n8n Workflow & Execution Analytics: workflow quality, throughput and errors from n8n's PostgreSQL database
- n8n data source plugin: workflow and execution data from the n8n public API, for n8n Cloud and self-hosted n8n
- Source: github.com/nluecke/grafana-n8n-dashboards
Data source config
Collector type:
Collector plugins:
Collector config:
Revisions
Upload an updated version of an exported dashboard.json file from Grafana
| Revision | Description | Created | |
|---|---|---|---|
| Download |