Azure / Insights / Applications / OTel / HTTP
Azure Monitor Application Insights with OpenTelemetry Metrics (HTTP) This dashboard requires OpenTelemetry metrics to be ingested into an Application Insights resource with OTLP enabled. For onboarding instructions, see [App Insights with OTel](https://aka.ms/AppInsightswithOTel) *Note: This dashboard should only be used for metrics which are ingested in cumulative temporality, the default setting for the Application Insights OpenTelemetry distro. [Learn More](https://aka.ms/OtelMetricTemp)*
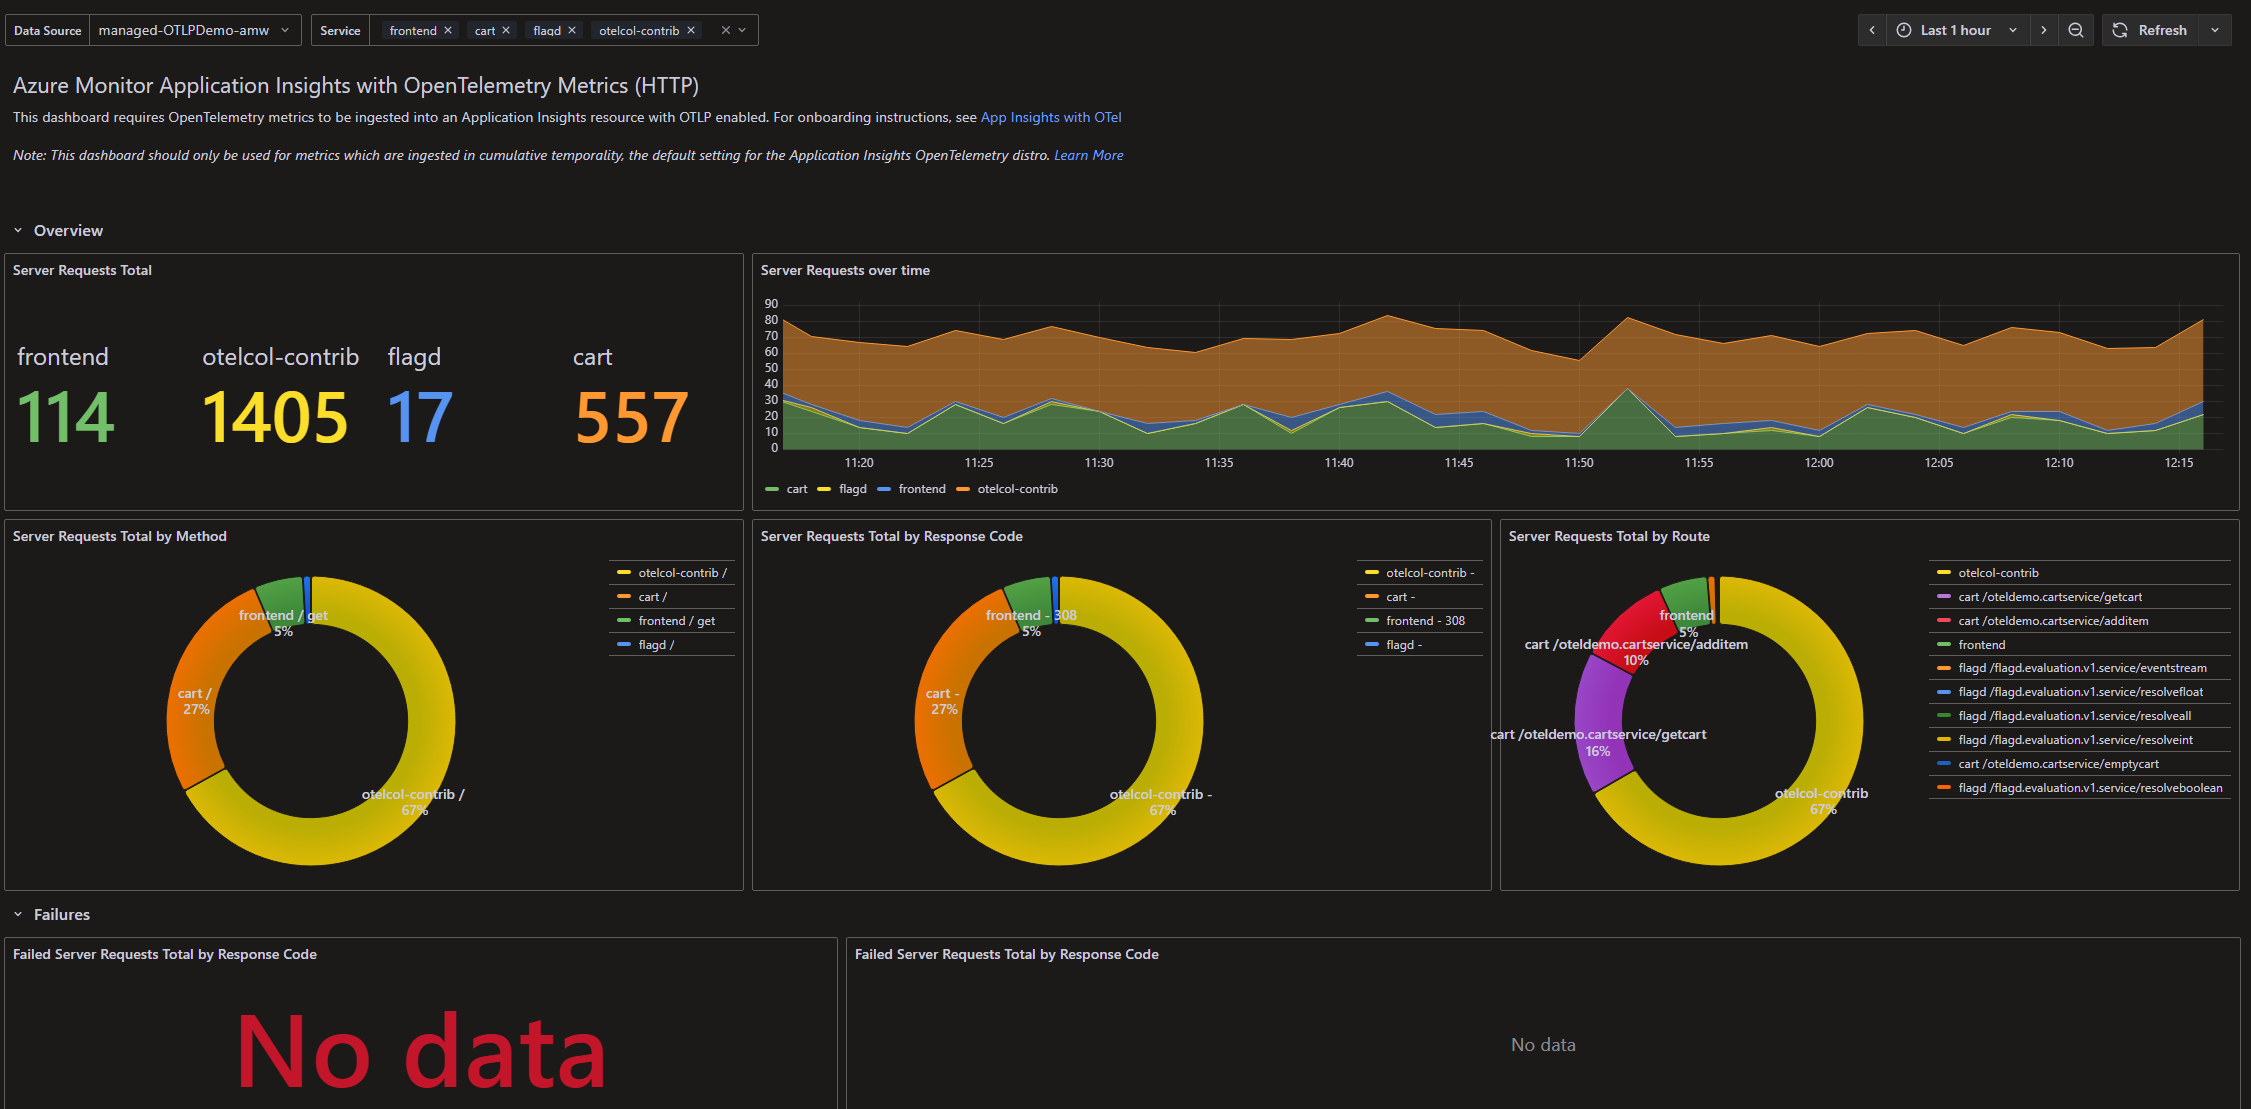
Azure Monitor Application Insights with OpenTelemetry Metrics (HTTP) This dashboard requires OpenTelemetry metrics to be ingested into an Application Insights resource with OTLP enabled. For onboarding instructions, see App Insights with OTel
Note: This dashboard should only be used for metrics which are ingested in cumulative temporality, the default setting for the Application Insights OpenTelemetry distro. Learn More
Data source config
Collector config:
Upload an updated version of an exported dashboard.json file from Grafana
| Revision | Description | Created | |
|---|---|---|---|
| Download |
Apache HTTP Server
Easily monitor Apache HTTP Server, an open source HTTP server for modern operating systems including UNIX and Windows, with Grafana Cloud's out-of-the-box monitoring solution.
Learn more