Grafana Dashboard for Veeam Software Appliance
Grafana Dashboard for Veeam Software Appliance using InfluxDB and Prometheus-like metrics (Unofficial)

Attention - This Dashboard has been built for InfluxDB v2.0 using Flux
Requires Veeam Software Appliance, or Veeam JeOS
Follow the instructions on the GitHub https://github.com/jorgedlcruz/veeam-appliance-monitoring/tree/main/node_exporter_bash
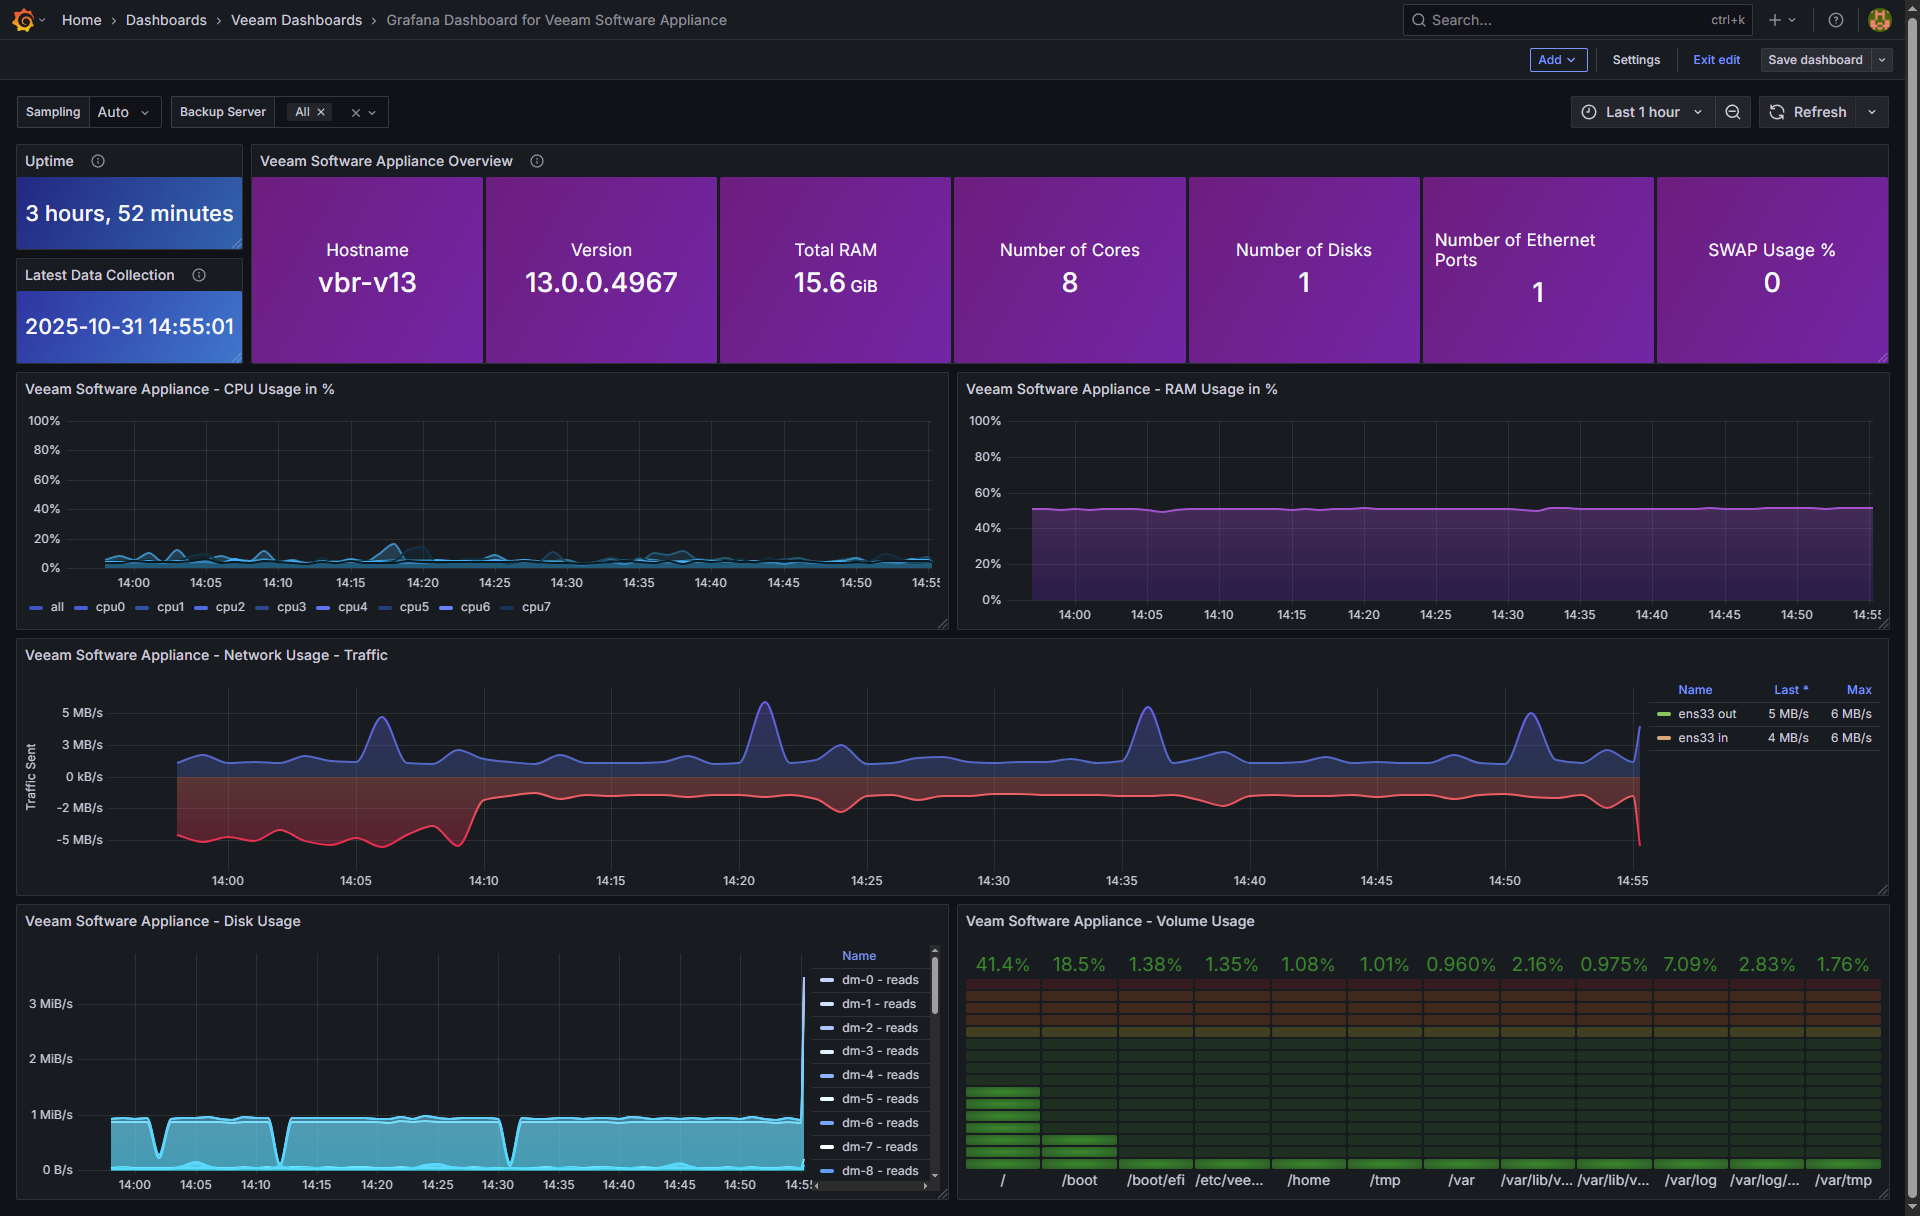
Then download or import this Dashboard to your Grafana, and you should see something similar to the next:

Data source config
Collector type:
Collector plugins:
Collector config:
Revisions
Upload an updated version of an exported dashboard.json file from Grafana
| Revision | Description | Created | |
|---|---|---|---|
| Download |