HPC / Combined Node, IB, GPU & NVLink Metrics Dashboard (w/o GPU Profiling)
This dashboard monitors HPC node performance by combining InfiniBand, GPU, and NVLink metrics for comprehensive interconnect and accelerator analysis.
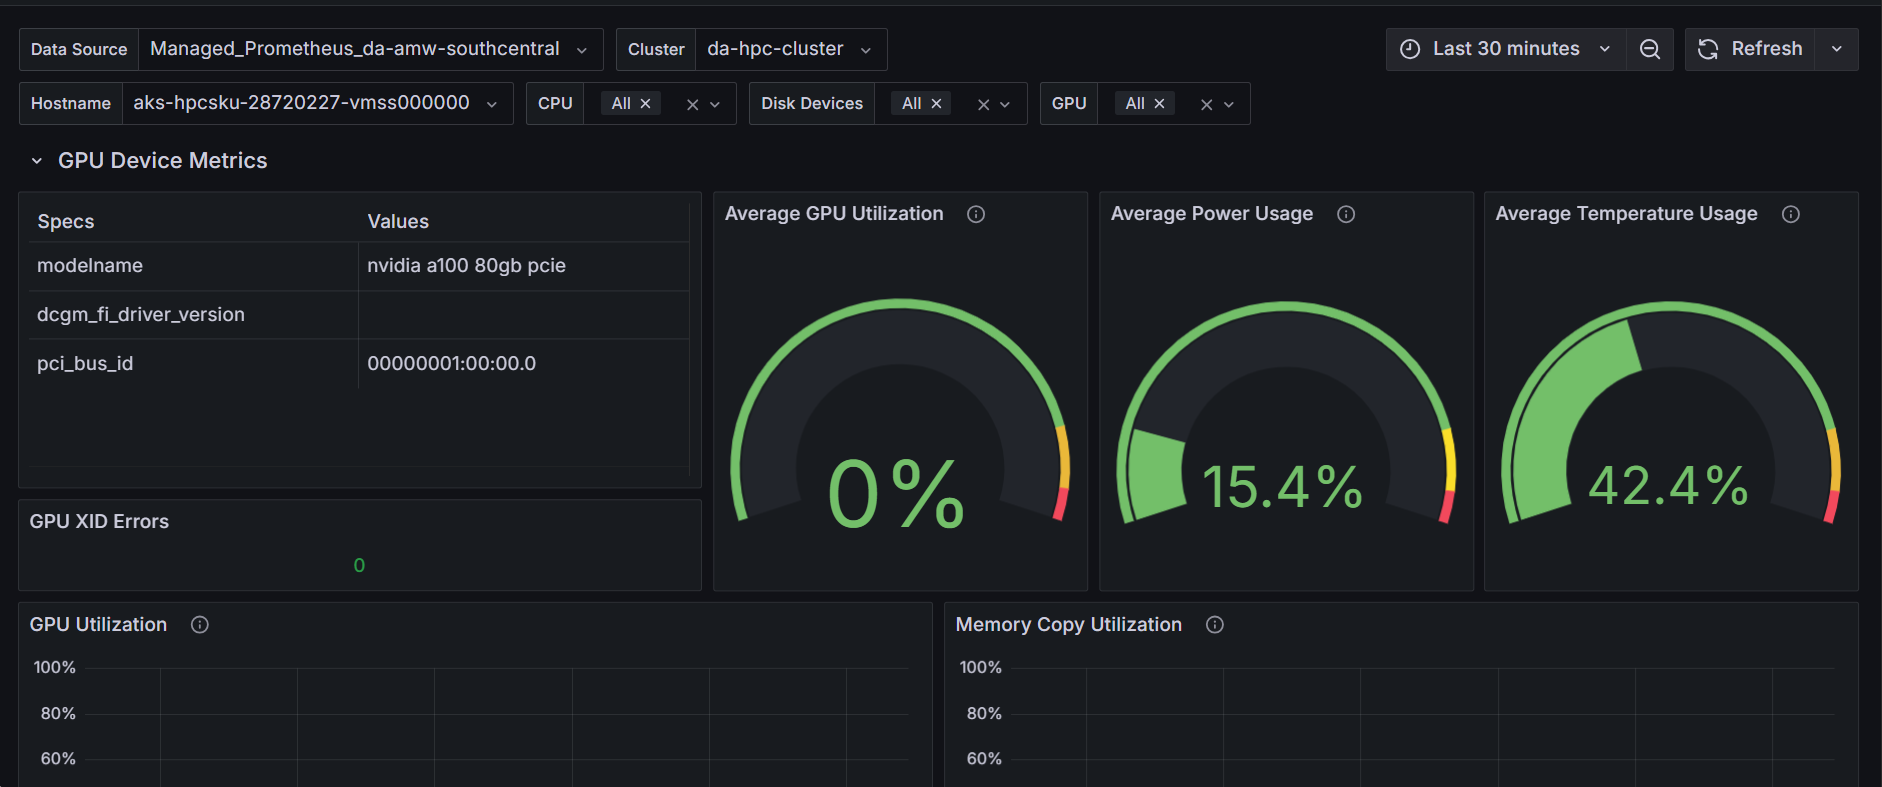
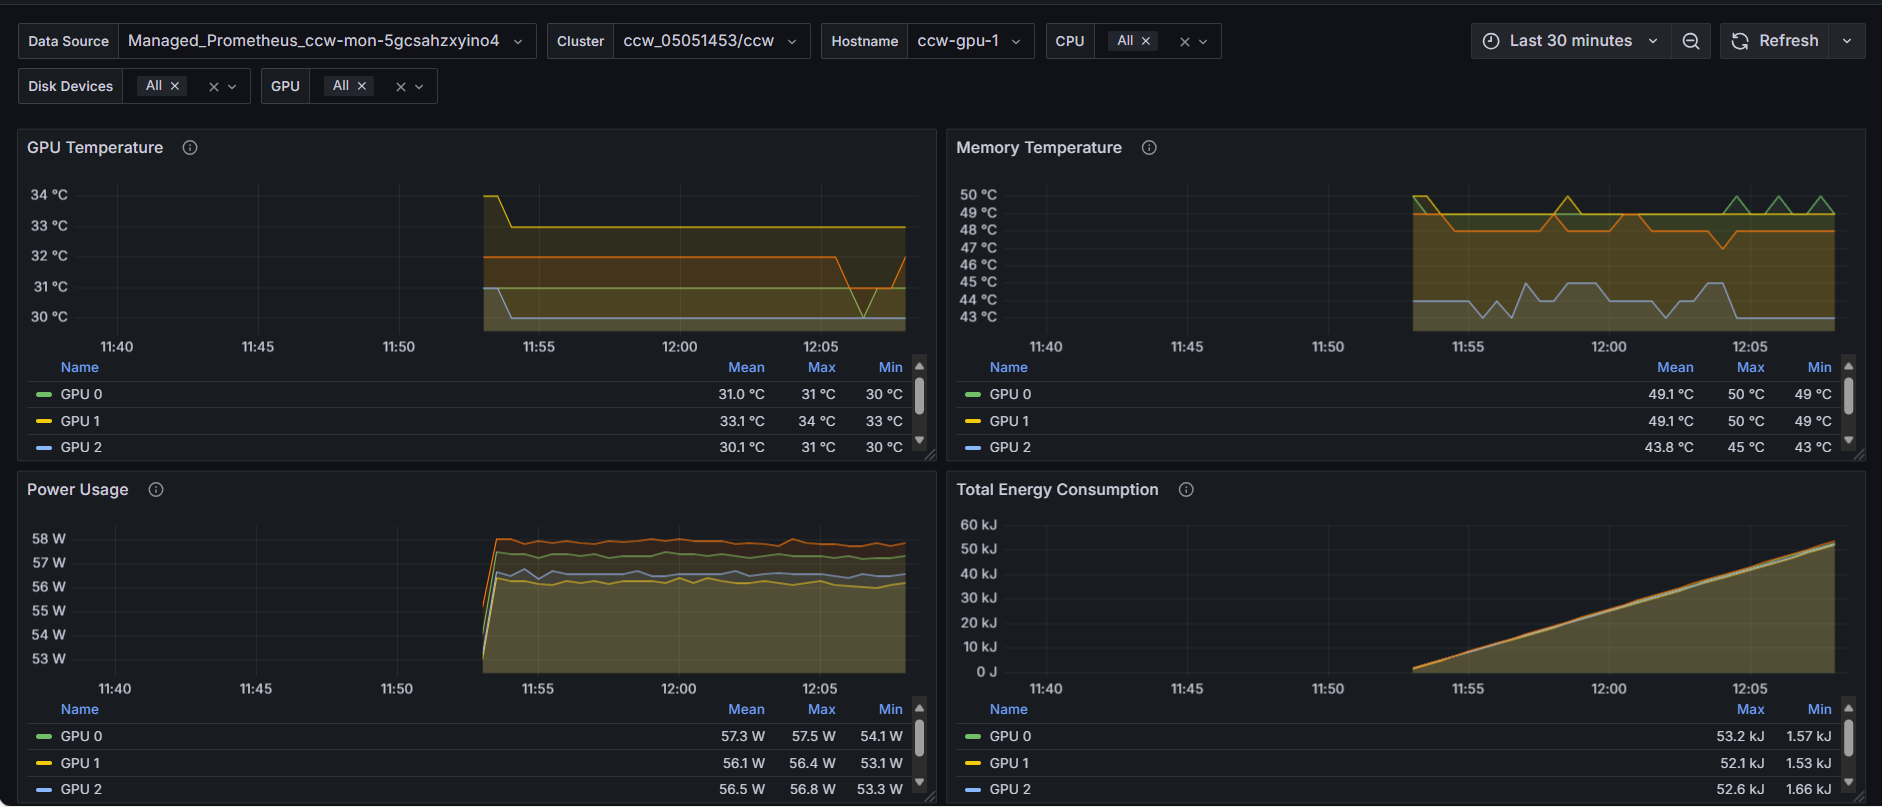
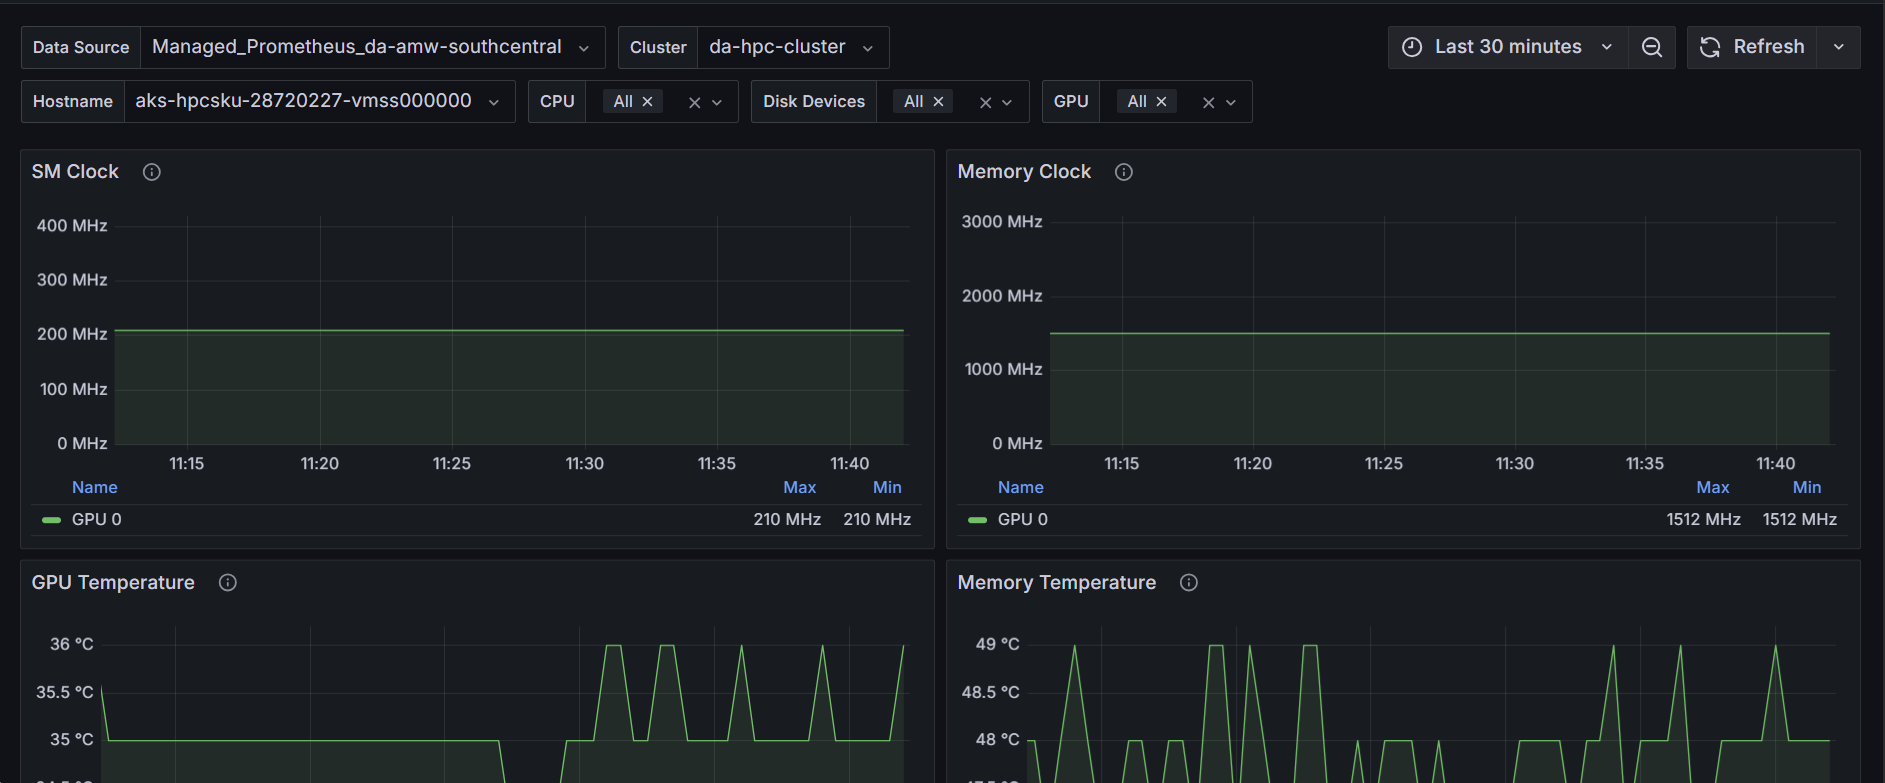
The HPC / Combined Node, IB, GPU & NVLink Metrics Dashboard (w/o GPU Profiling) dashboard uses the prometheus data source to create a Grafana dashboard with the gauge, stat, state-timeline, table, text and timeseries panels.
Data source config
Collector type:
Collector plugins:
Collector config:
Revisions
Upload an updated version of an exported dashboard.json file from Grafana
| Revision | Description | Created | |
|---|---|---|---|
| Download |