HPC / Cluster View (Heat Map & Tables)
This dashboard provides a heat map view of HPC (High-Performance Computing) cluster metrics in tabular format for monitoring node-level performance and resource utilization.
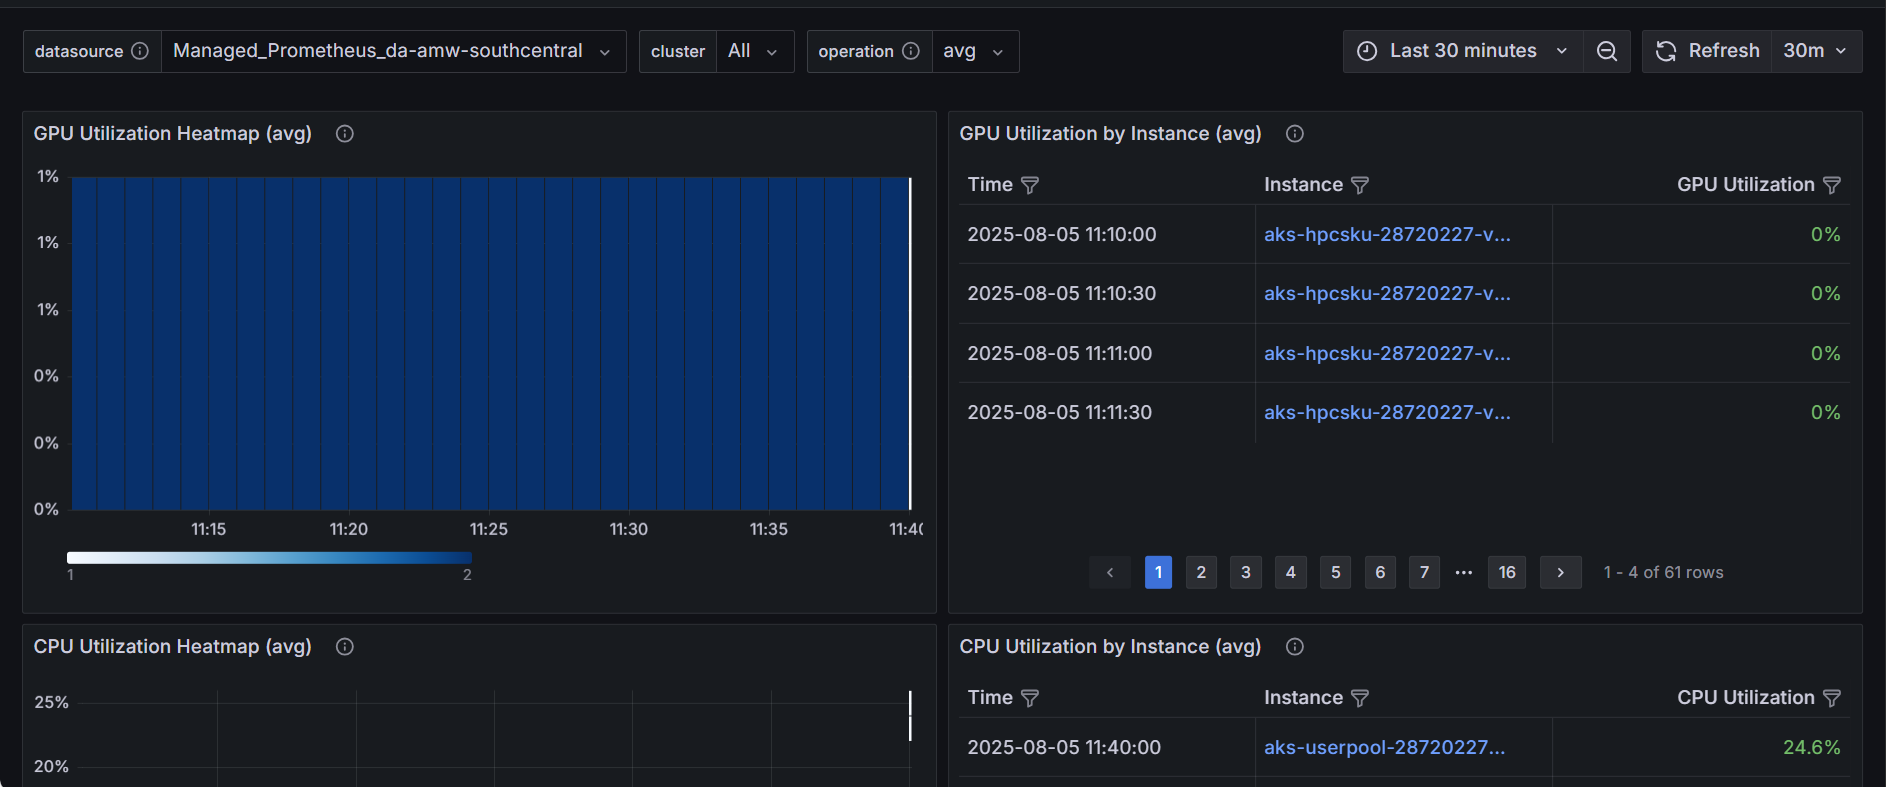
The HPC / Cluster View (Heat Map & Tables) dashboard uses the prometheus data source to create a Grafana dashboard with the heatmap, table and text panels.
Data source config
Collector type:
Collector plugins:
Collector config:
Revisions
Upload an updated version of an exported dashboard.json file from Grafana
| Revision | Description | Created | |
|---|---|---|---|
| Download |