Managed Kubernetes Overview
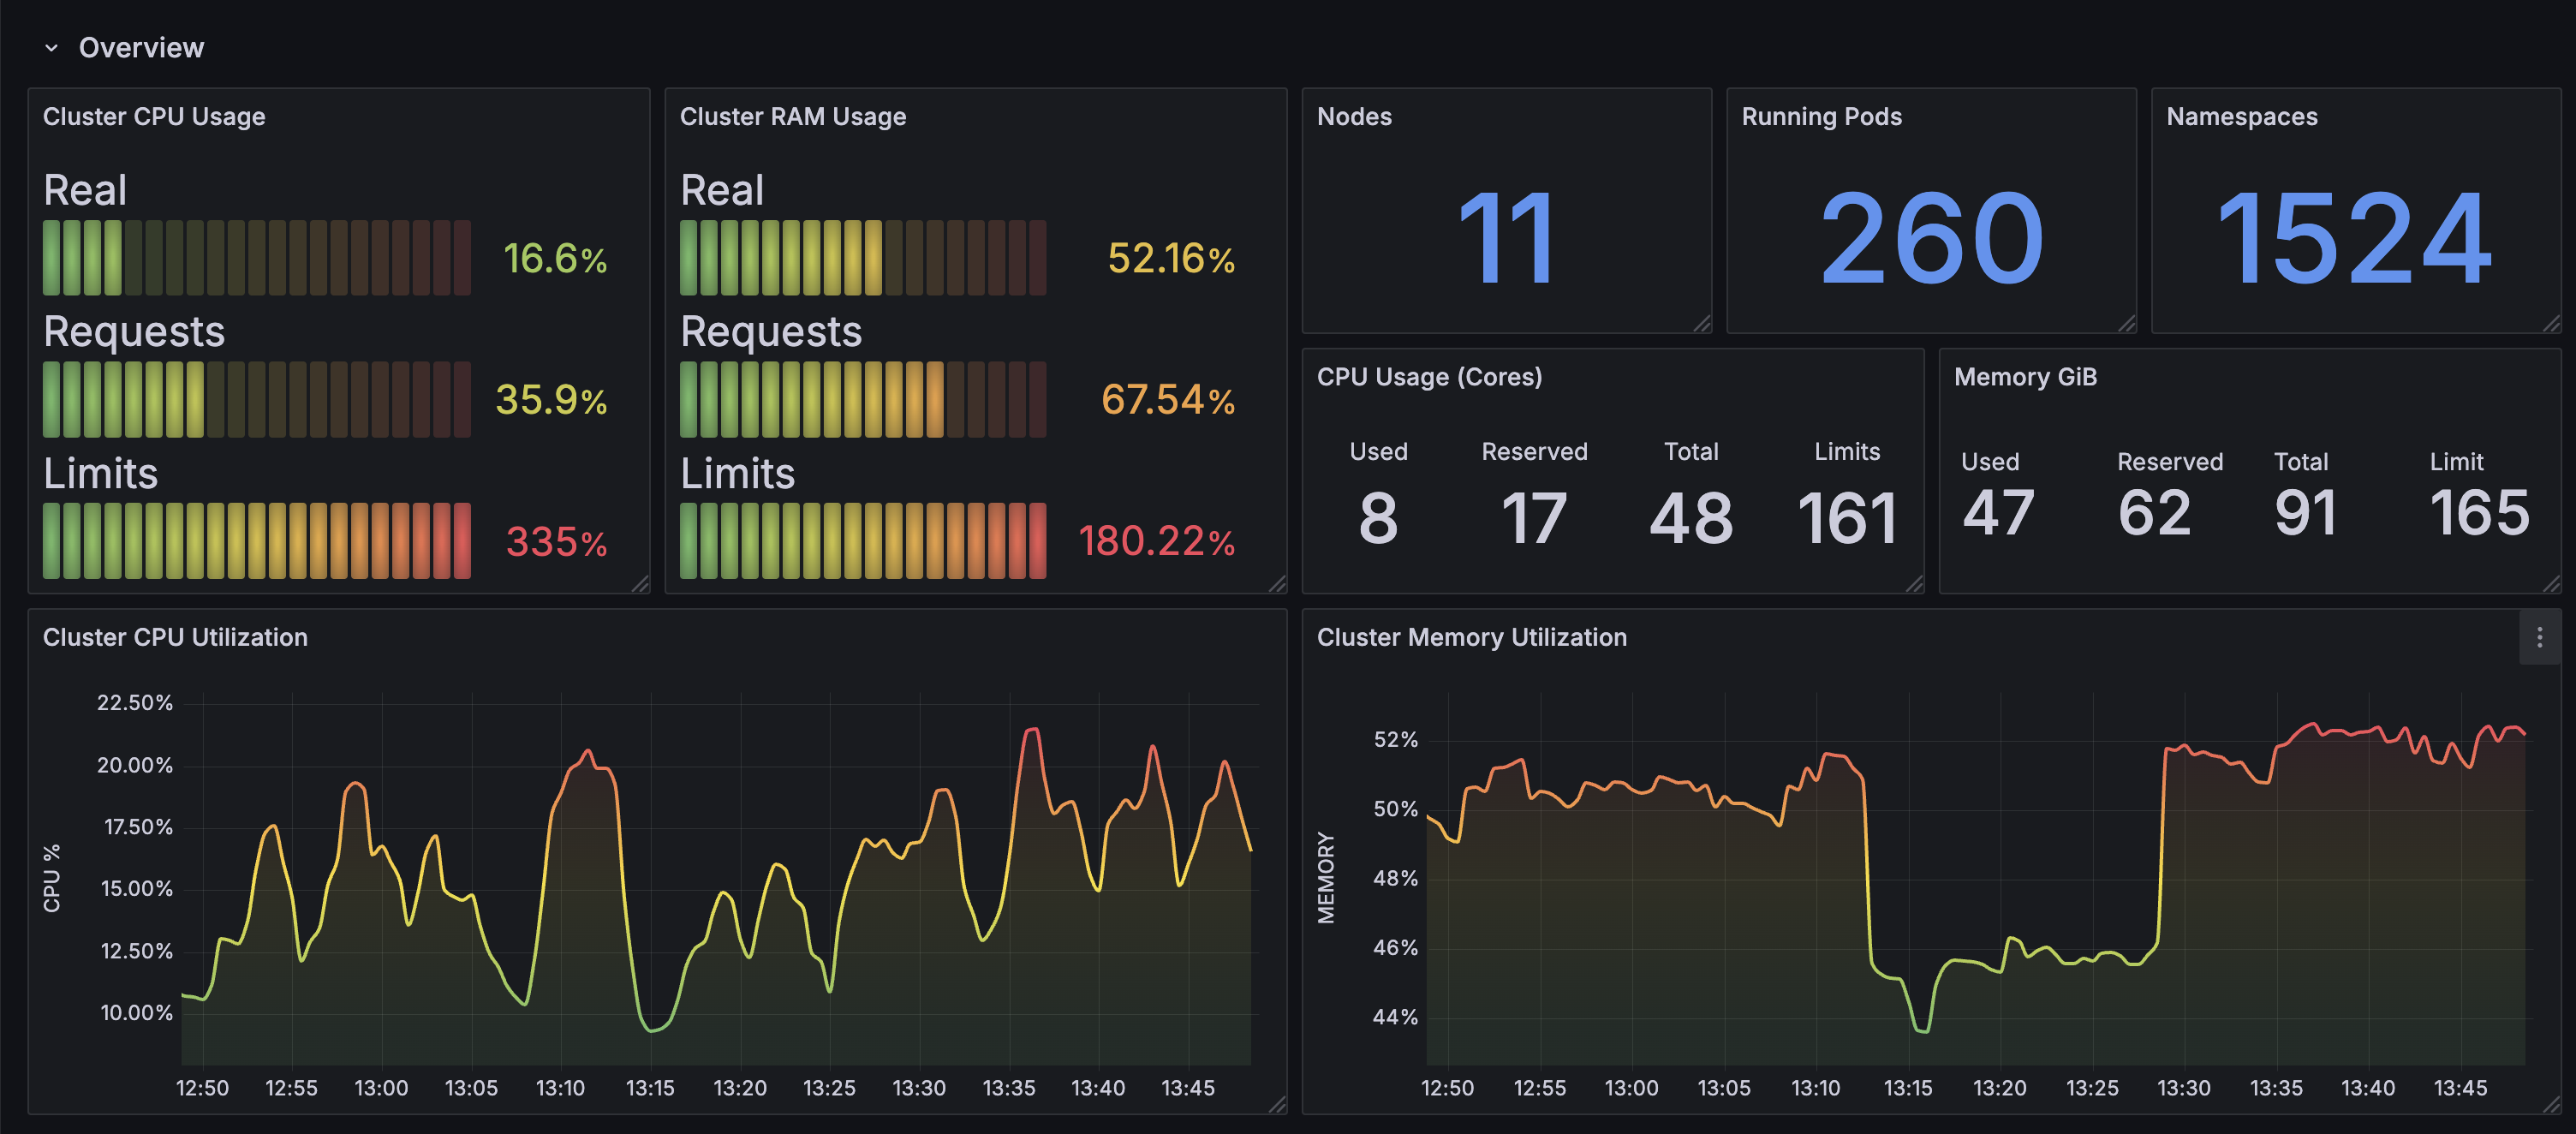
This is a modern 'Global View' dashboard for your Kubernetes cluster(s). Made for kube-prometheus-stack and take advantage of the latest Grafana features. Forked and modified version of: https://github.com/dotdc/grafana-dashboards-kubernetes
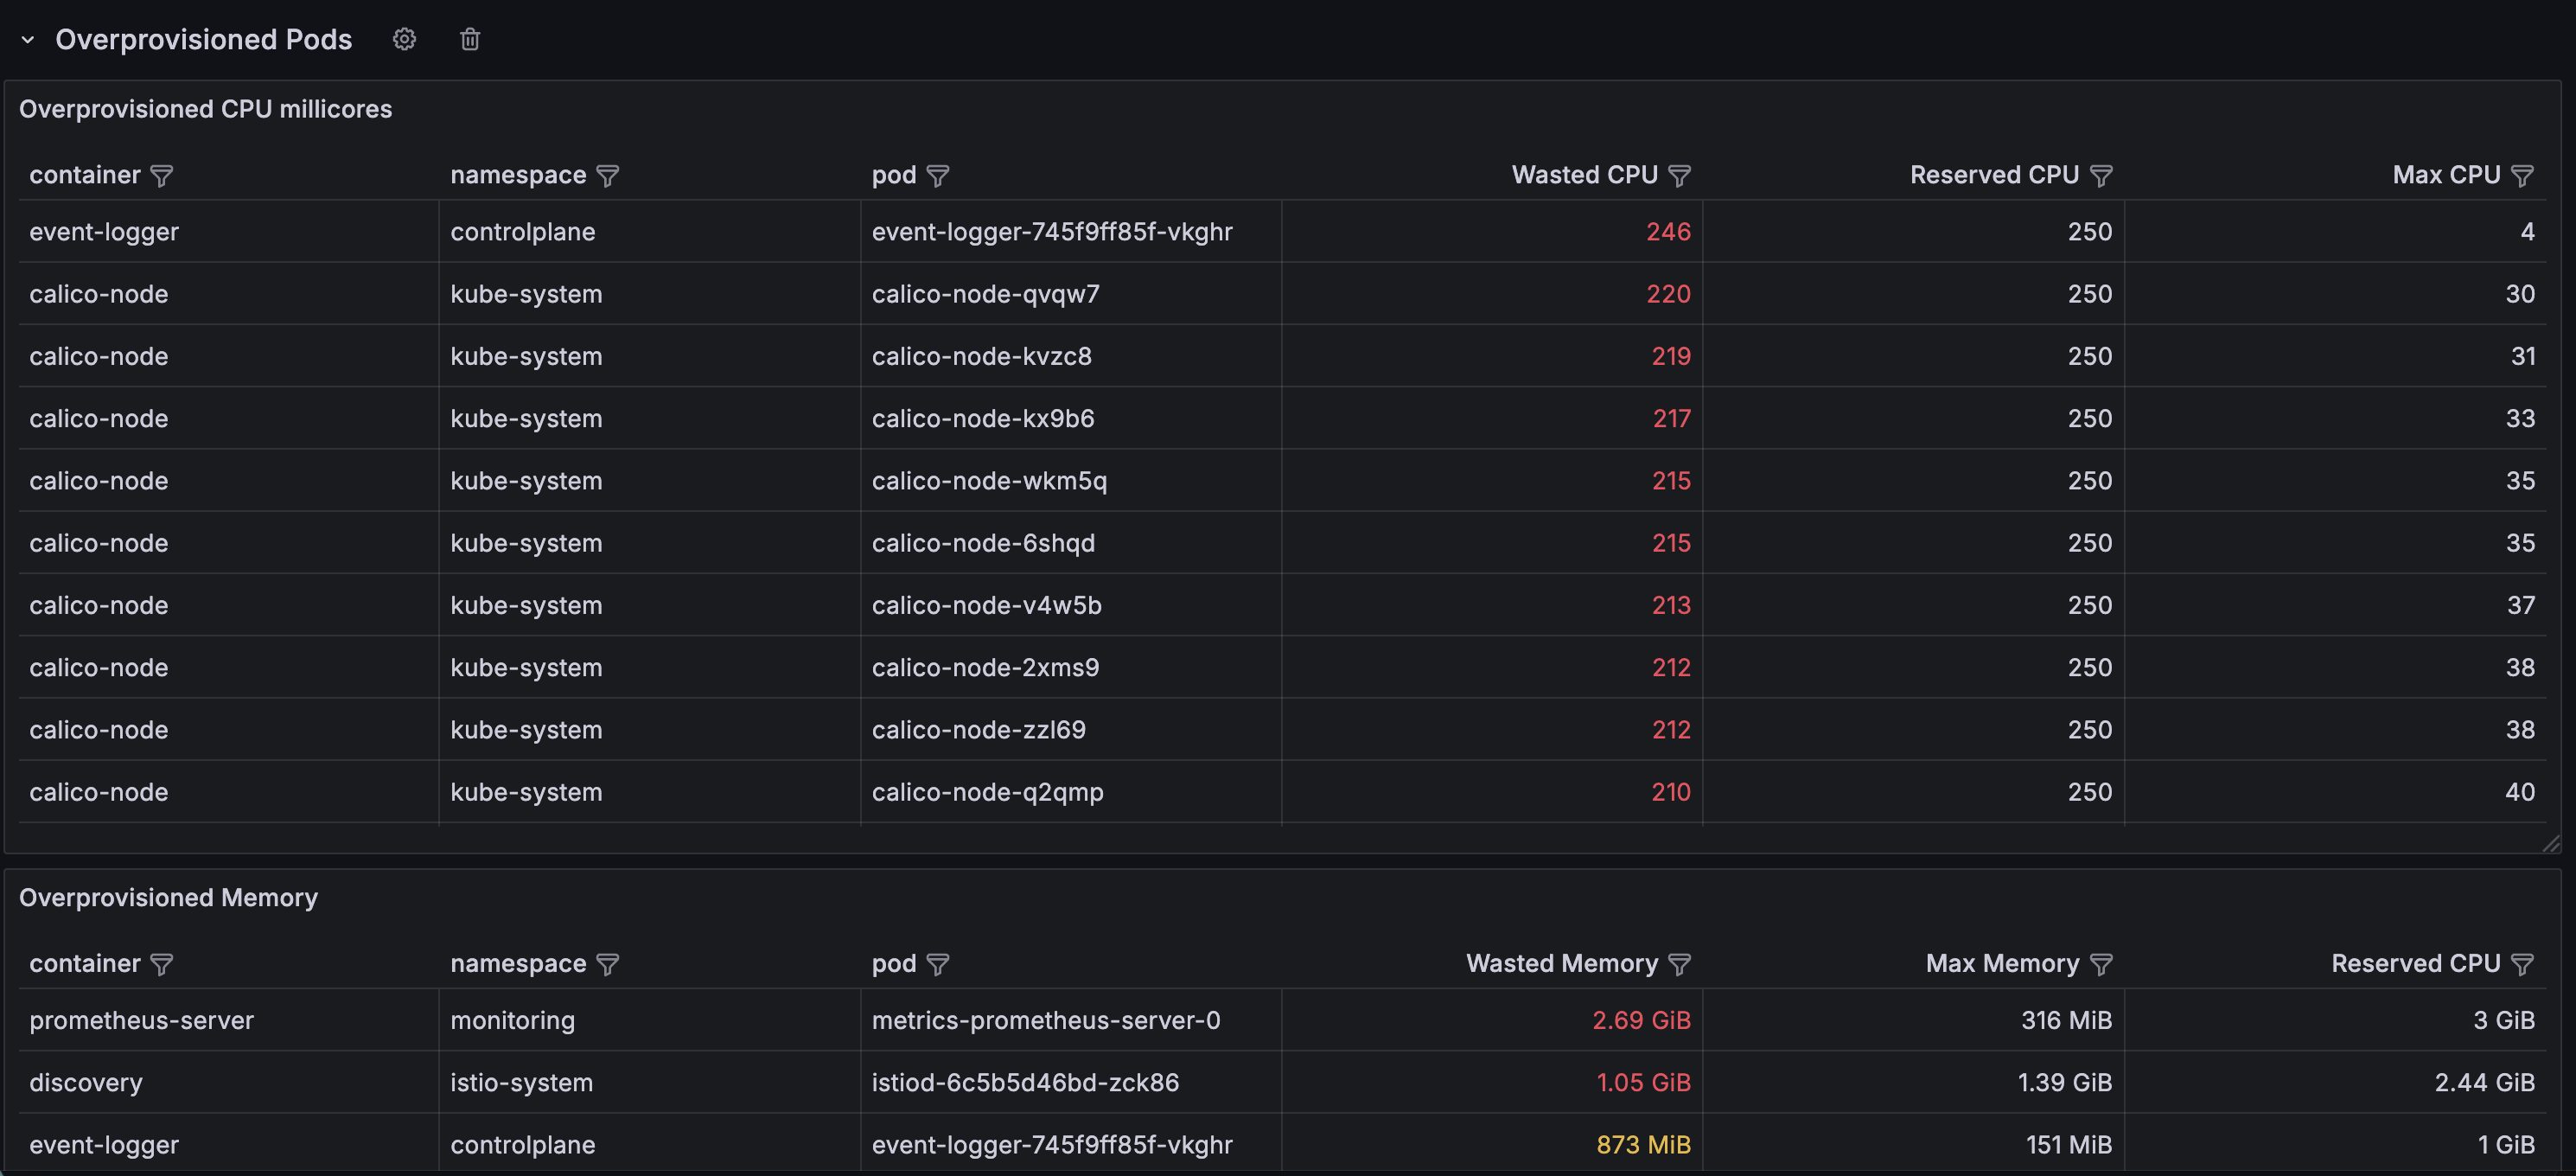
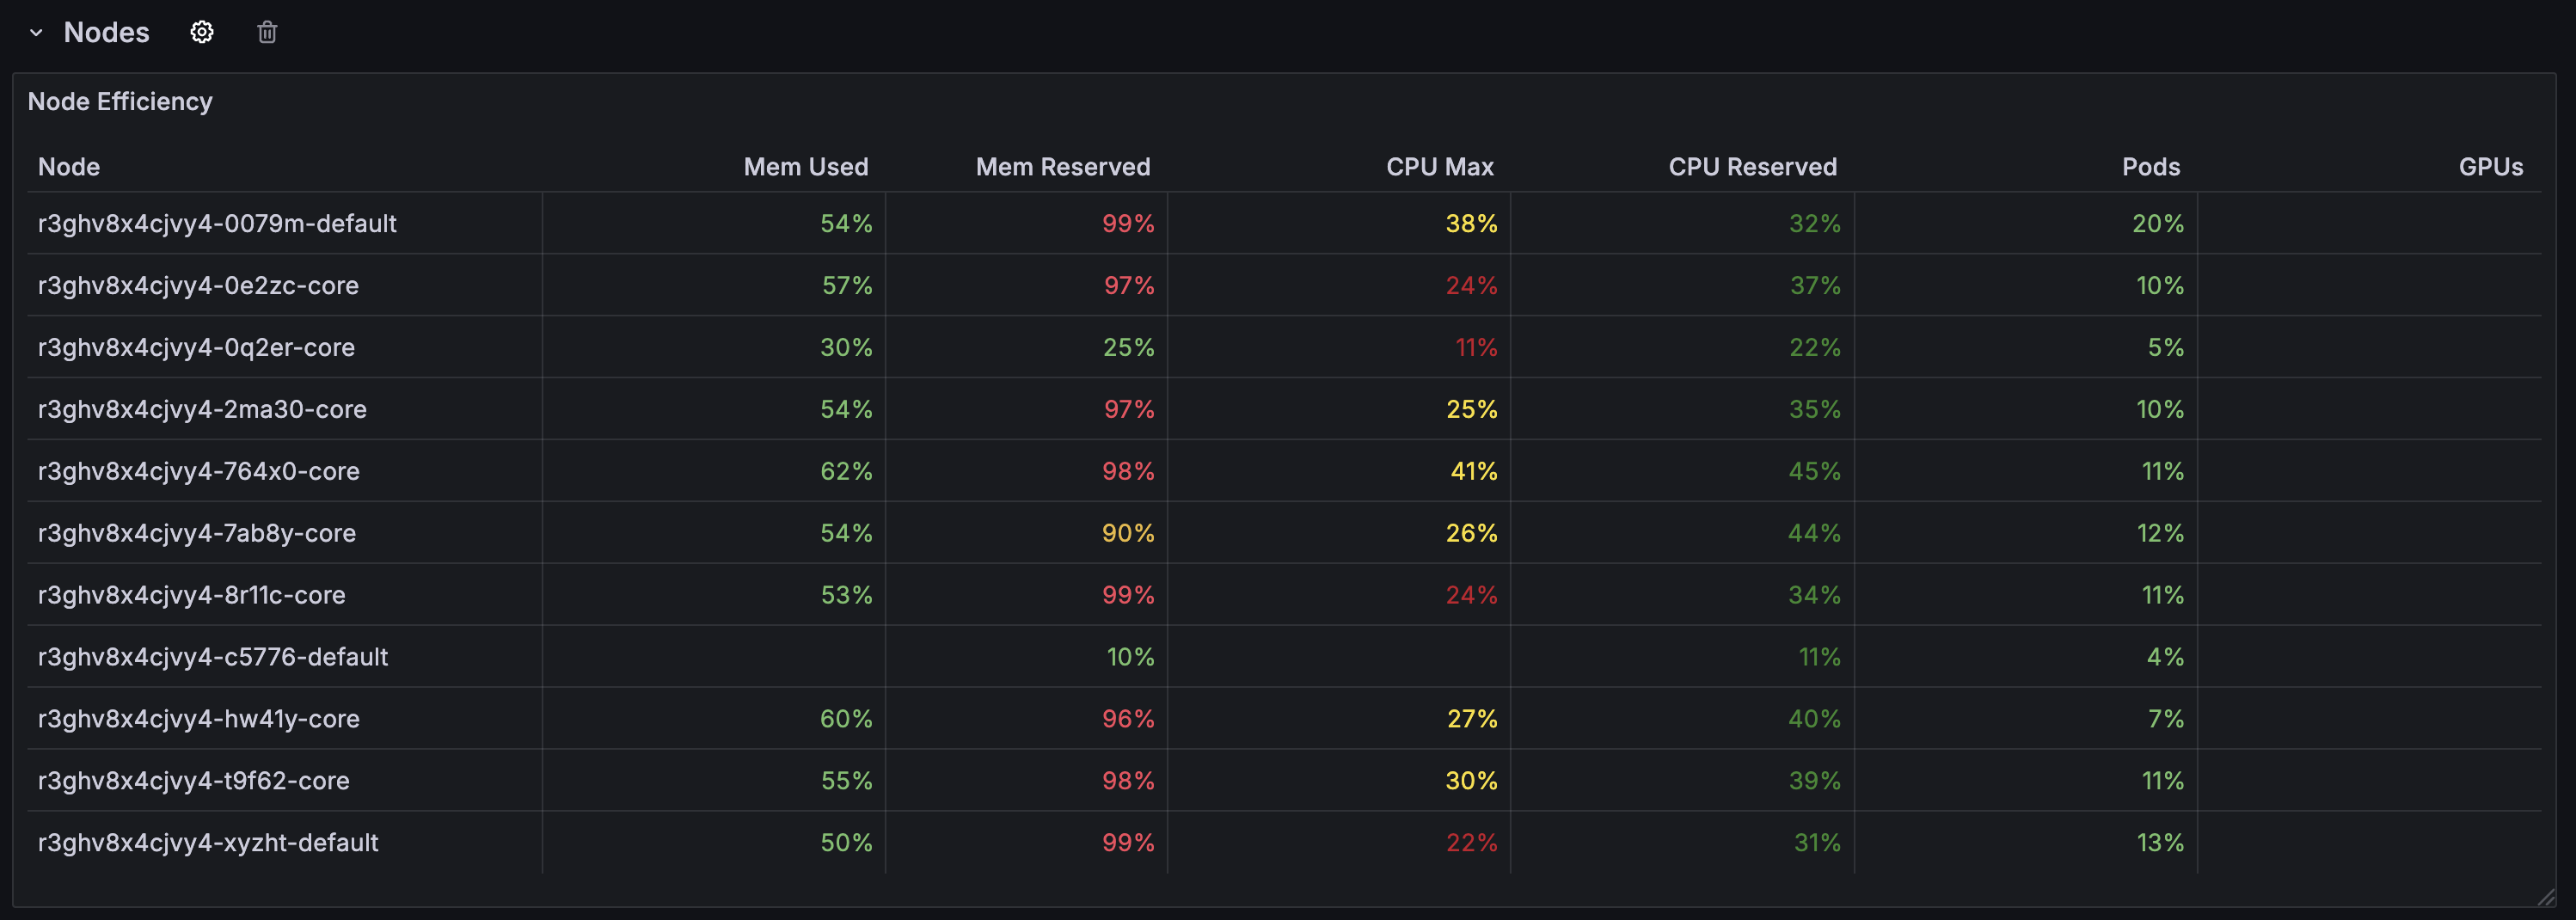
kube-state-metrics, cadvisor & node-exporter are all required
Data source config
Collector type:
Collector plugins:
Collector config:
Revisions
Upload an updated version of an exported dashboard.json file from Grafana
| Revision | Description | Created | |
|---|---|---|---|
| Download |
Kubernetes
Monitor your Kubernetes deployment with prebuilt visualizations that allow you to drill down from a high-level cluster overview to pod-specific details in minutes.
Learn more