Azure / Insights / Containers / ContainerLogV2 Analytics Tier
Dashboard visualizing ContainerLogV2 records collected by Azure Monitor
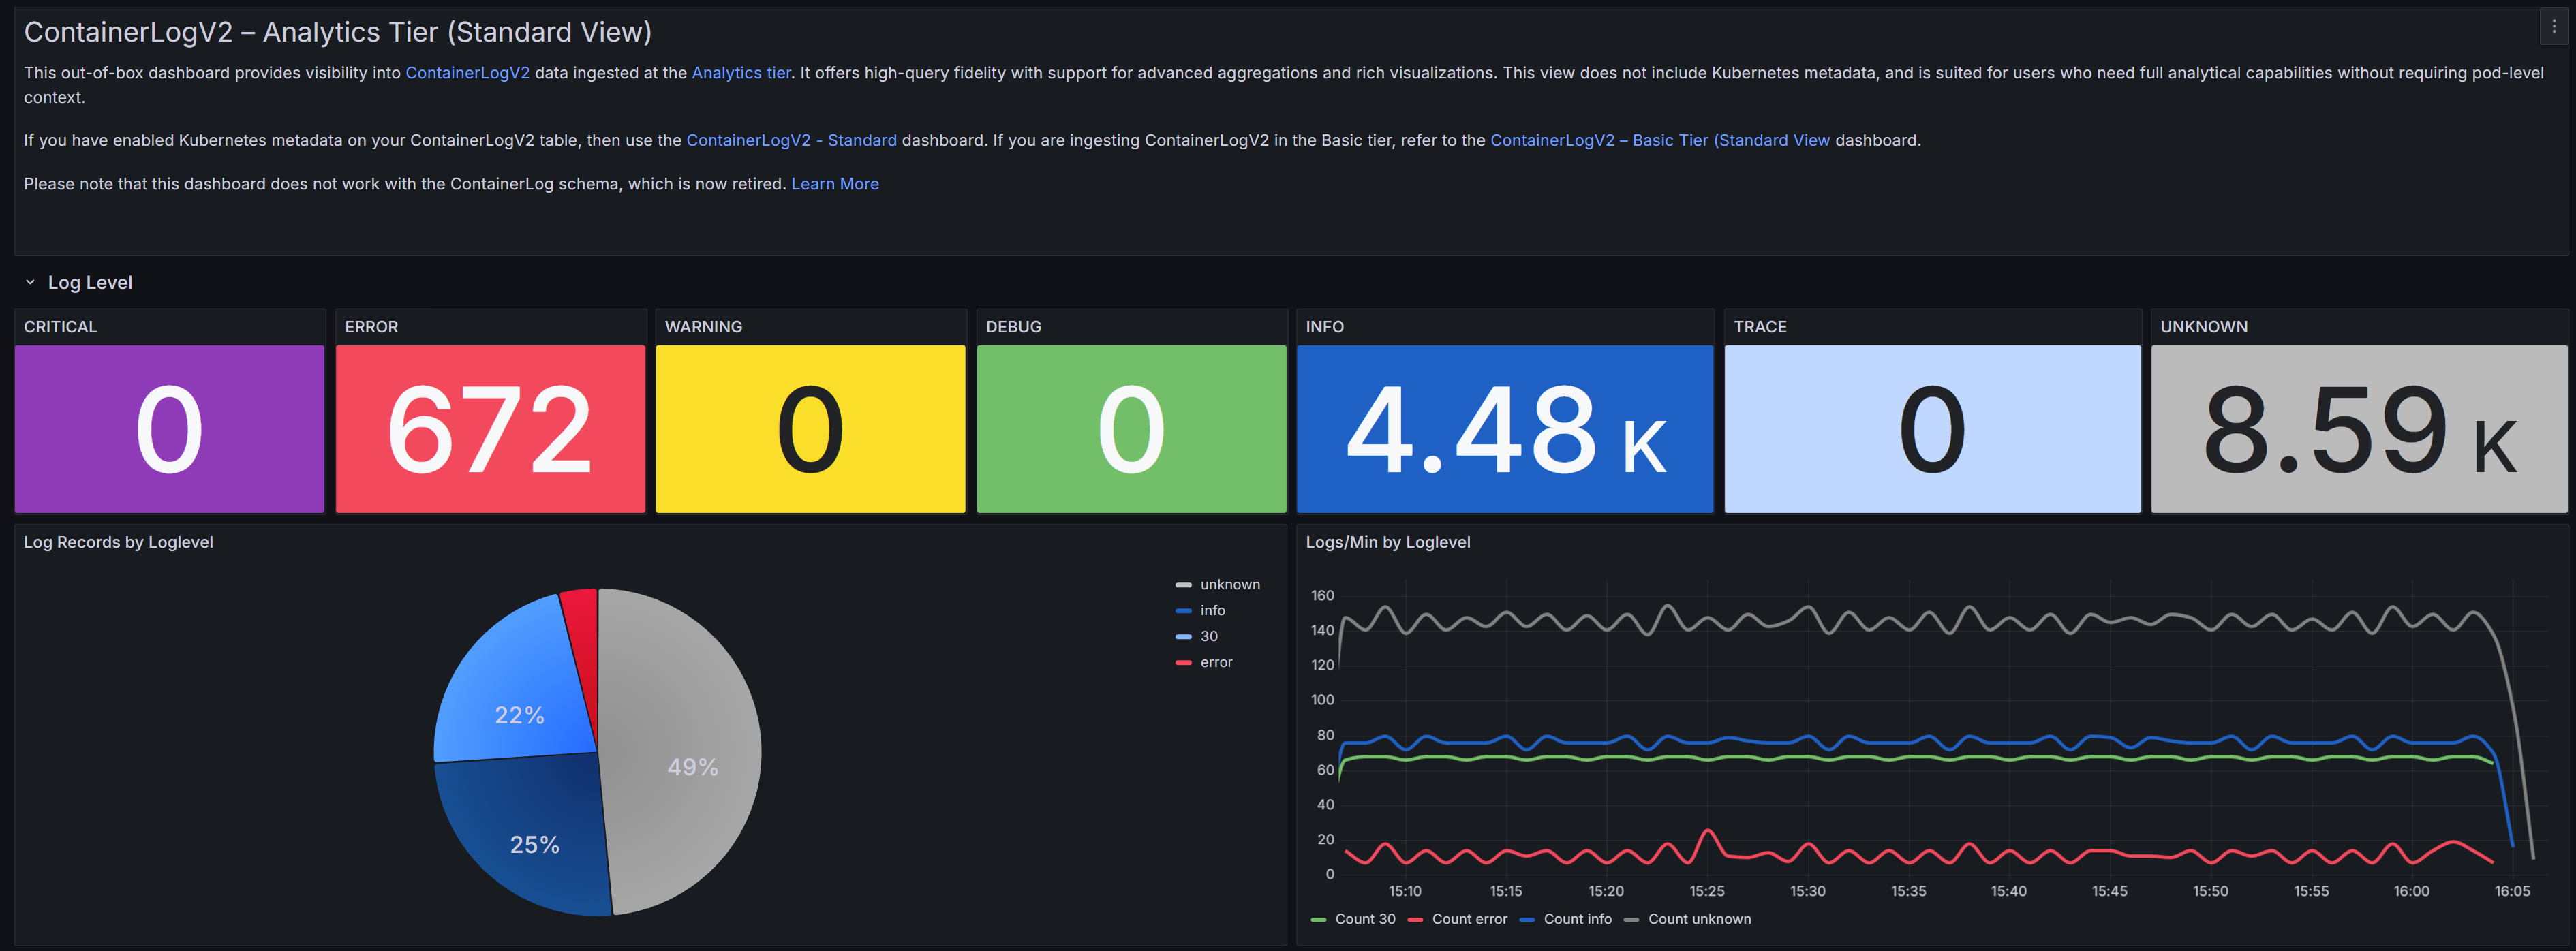
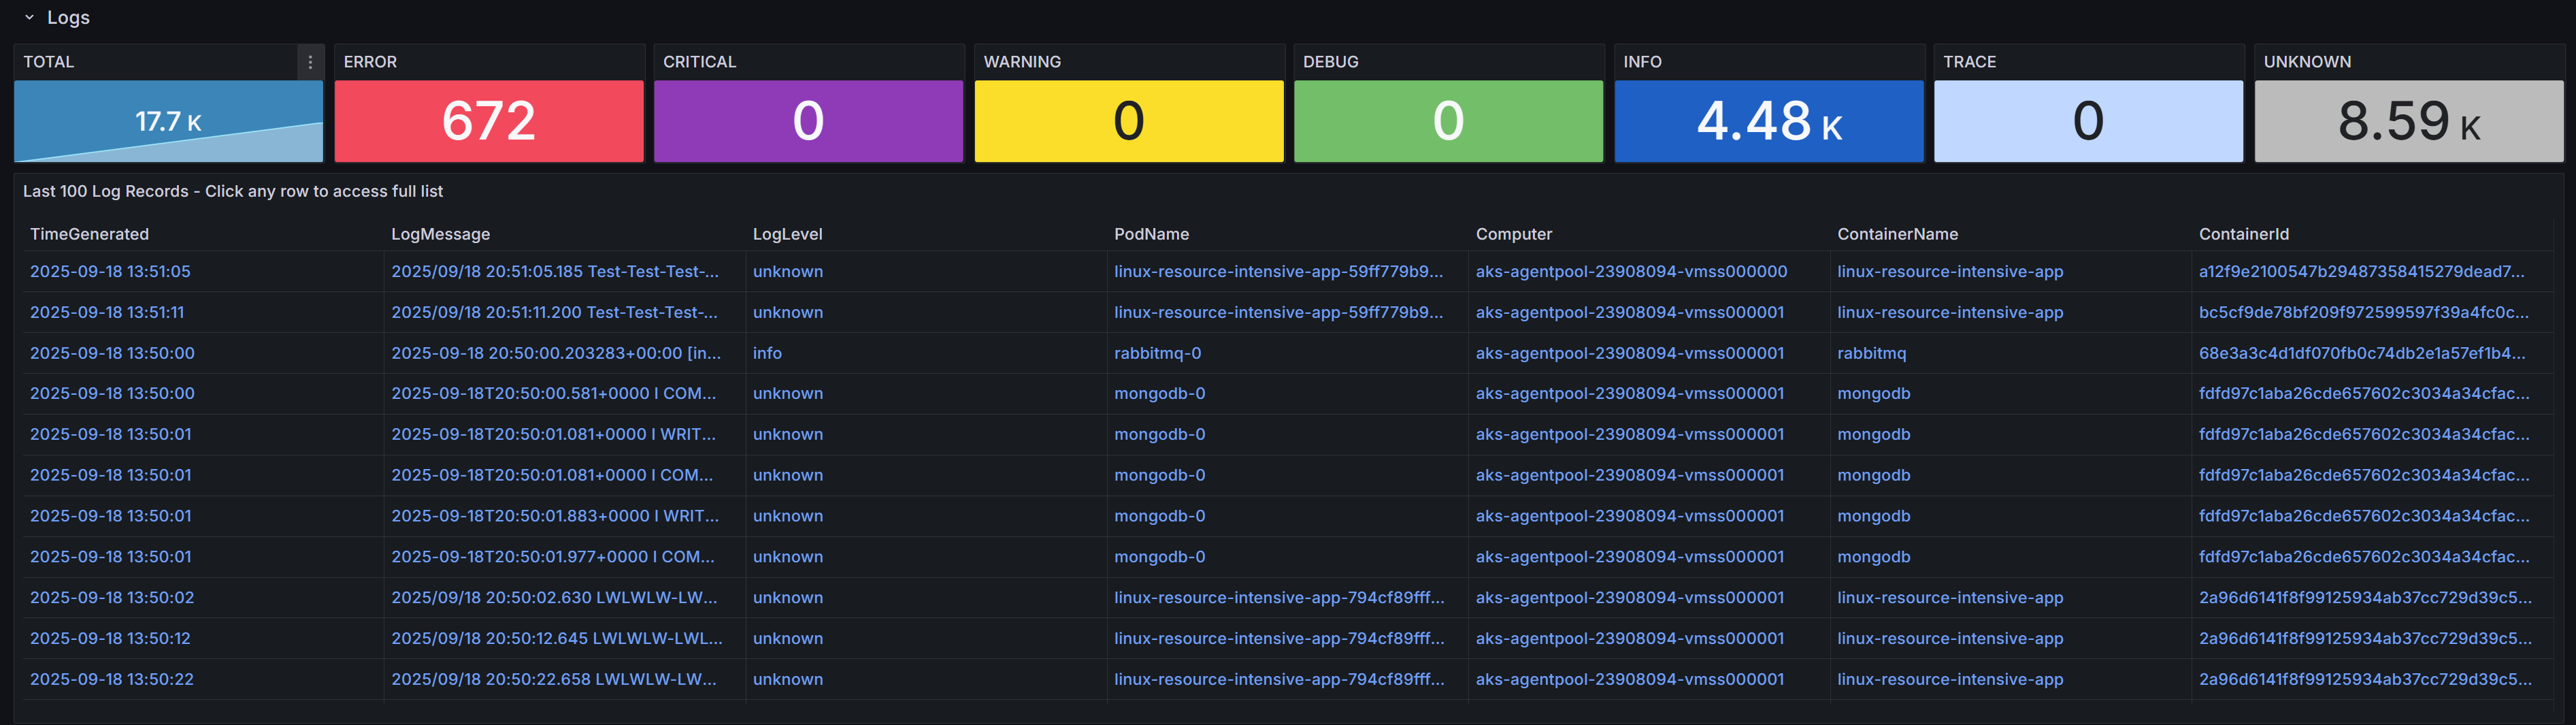
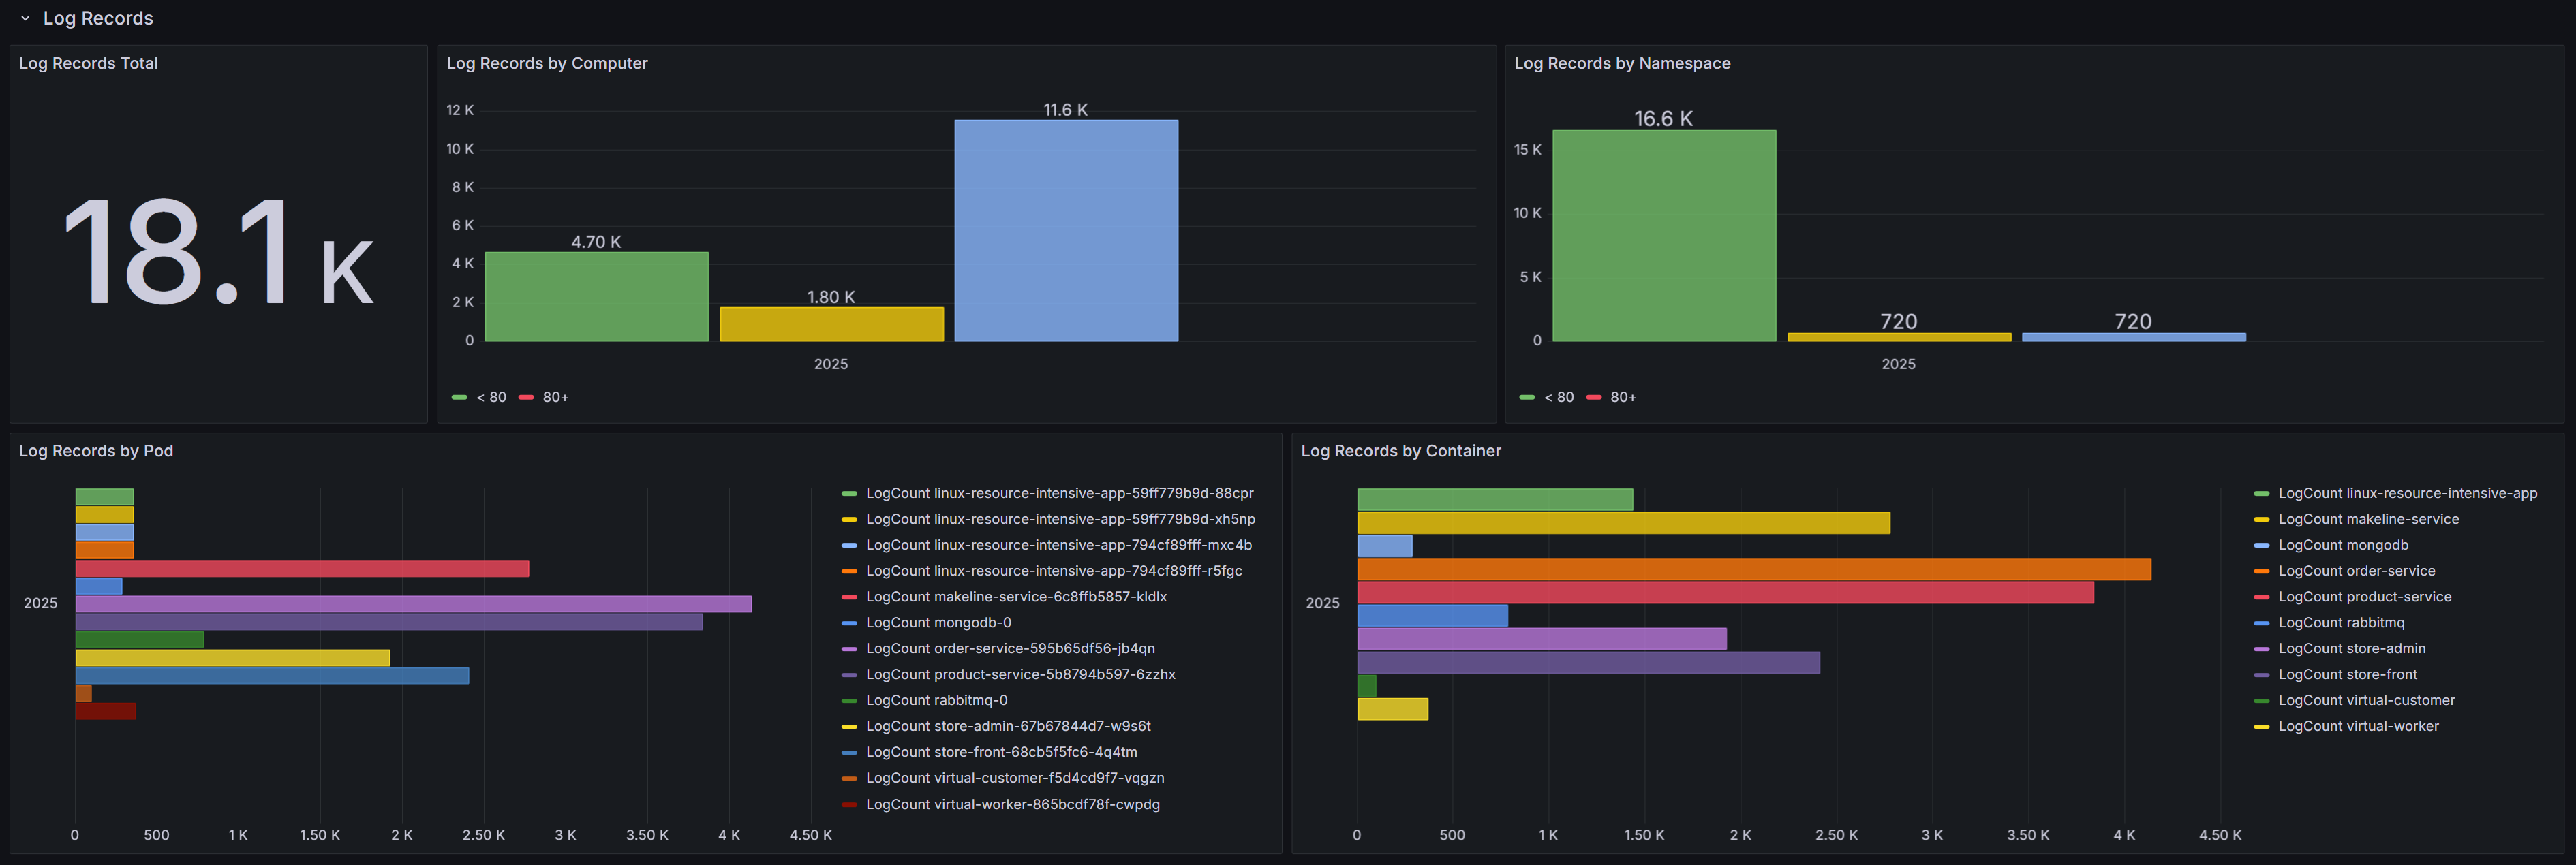
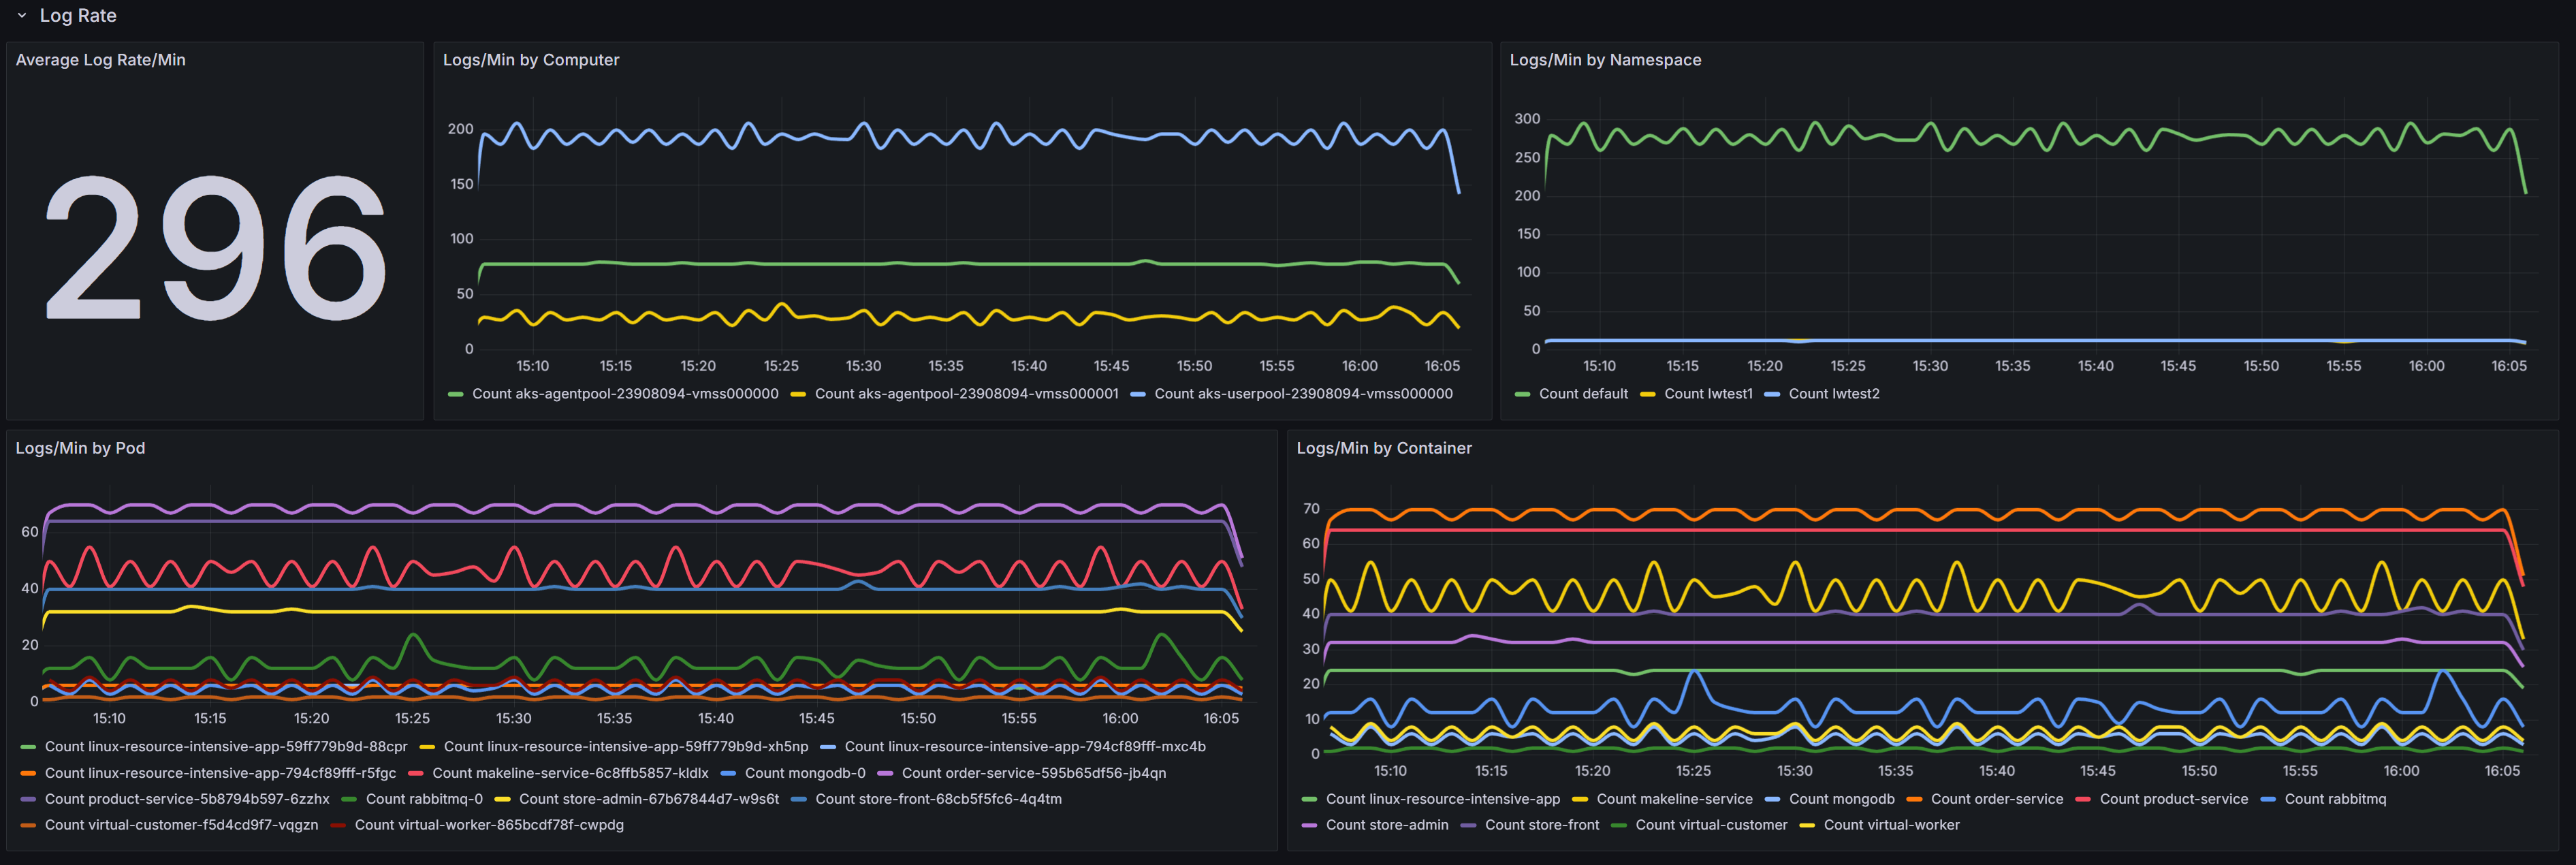
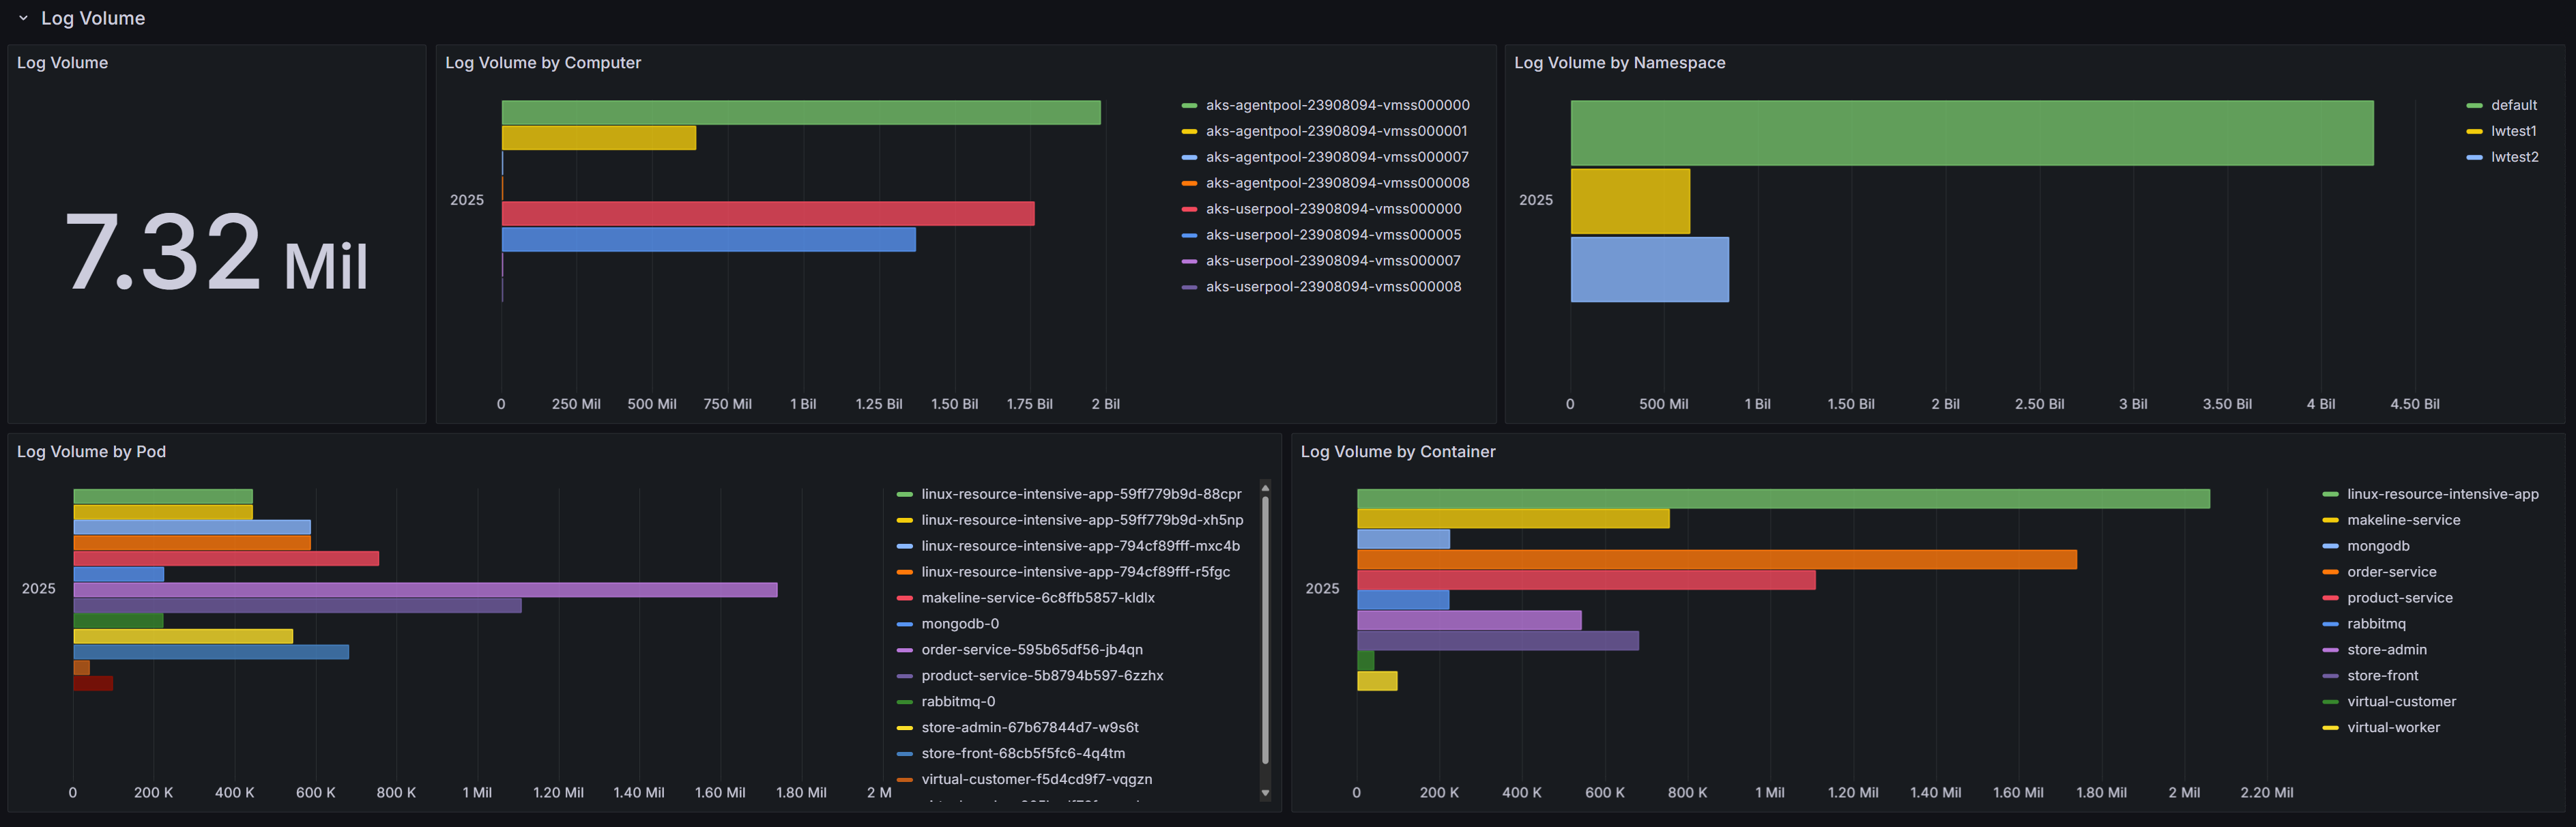
The Azure / Insights / Containers / ContainerLogV2 Analytics Tier dashboard uses the grafana-azure-monitor-datasource data source to create a Grafana dashboard with the barchart, piechart, stat, table, text and timeseries panels.
Data source config
Collector type:
Collector plugins:
Collector config:
Revisions
Upload an updated version of an exported dashboard.json file from Grafana
| Revision | Description | Created | |
|---|---|---|---|
| Download |
Adobe Analytics
With the Grafana plugin for Adobe Analytics, you can quickly visualize and query your Adobe Analytics data from within Grafana.
Learn more