
Frontend Performance Monitoring – Sitespeed with InfluxDB
This dashboard tracks frontend performance and user experience metrics collected via Sitespeed and InfluxDB. It provides insights into hit counts, performance scores, and key Core Web Vitals such as LCP, FCP, CLS, TTFB, TBT, INP, along with visually complete timings to help monitor and optimize web application performance
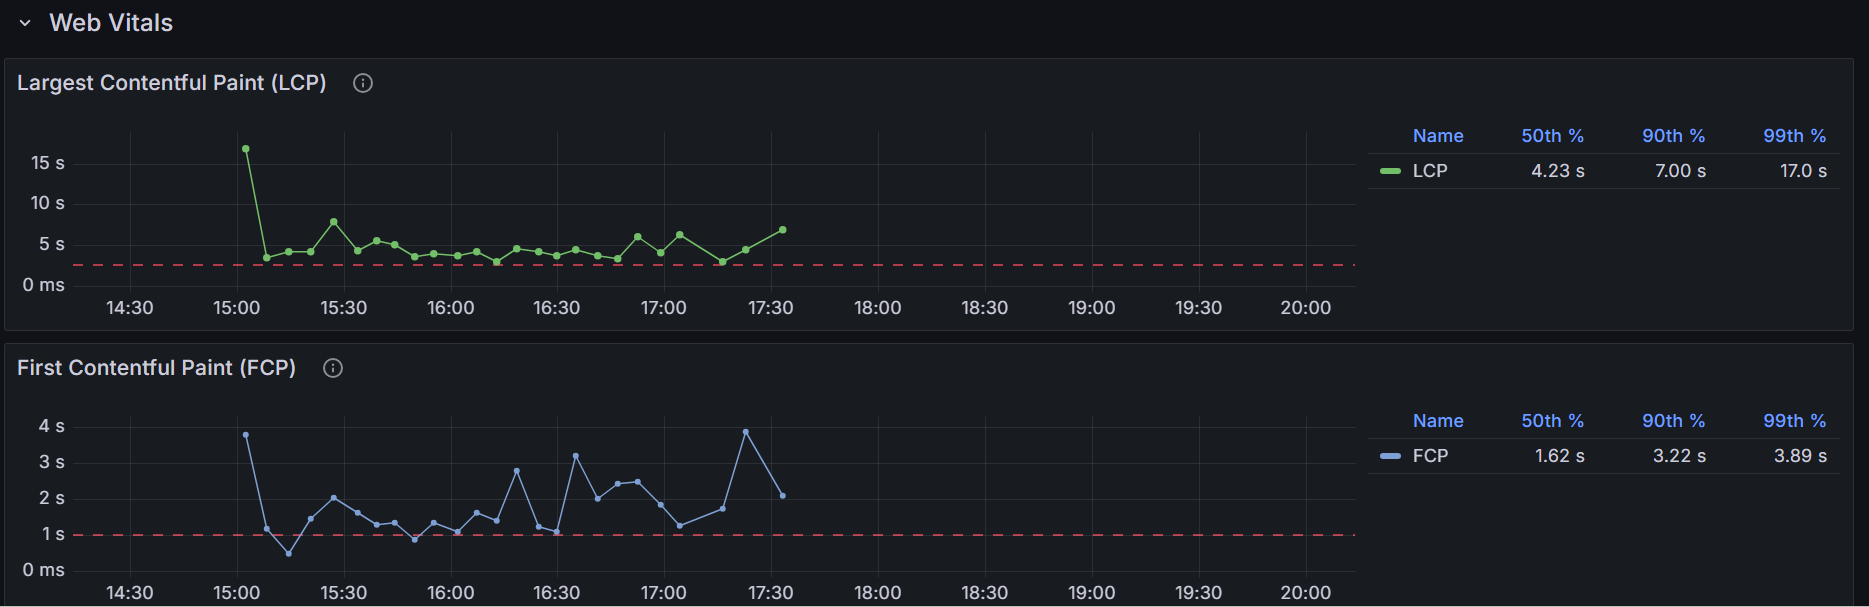
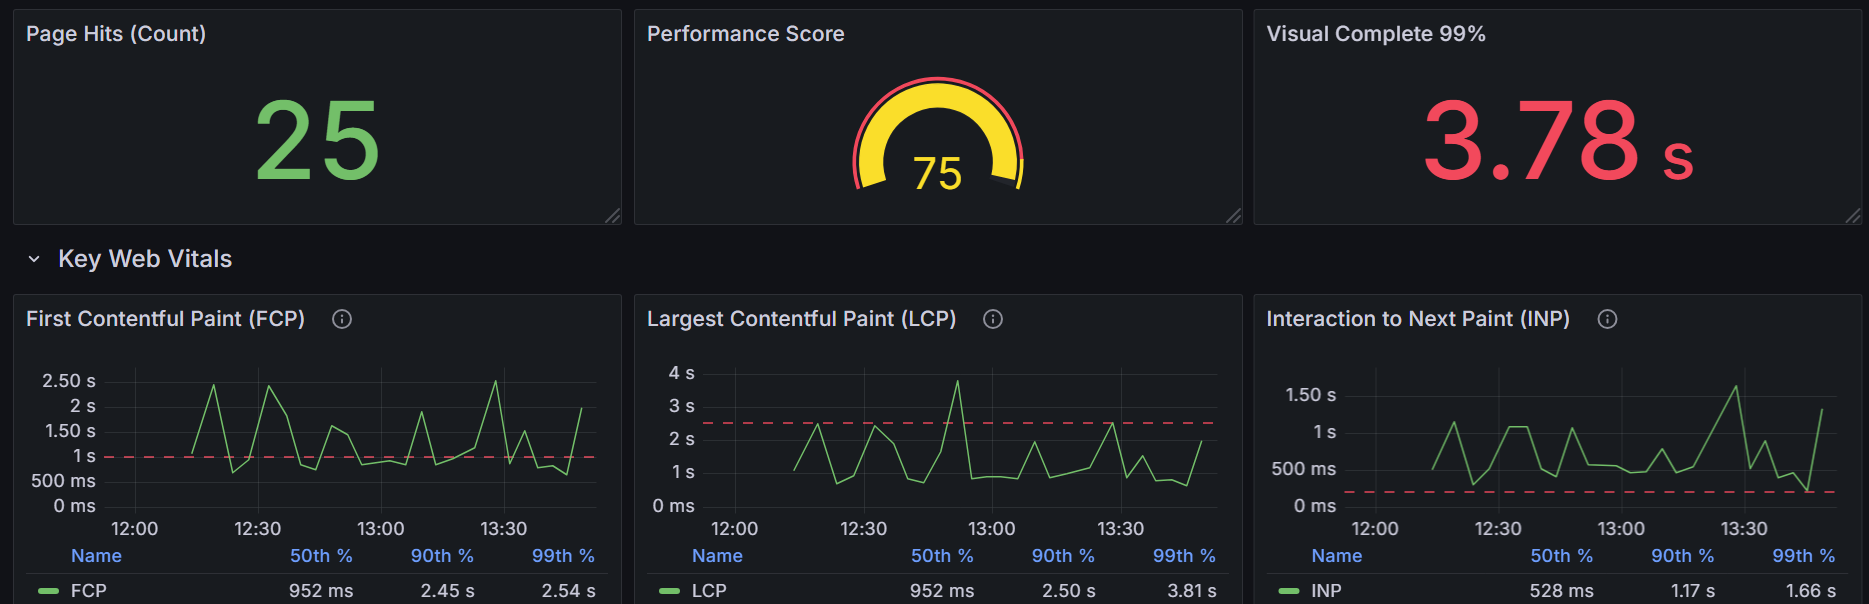
The Frontend Performance Monitoring – Sitespeed with InfluxDB dashboard uses the influxdb data source to create a Grafana dashboard with the gauge, stat and timeseries panels.
Data source config
Collector type:
Collector plugins:
Collector config:
Revisions
Upload an updated version of an exported dashboard.json file from Grafana
| Revision | Description | Created | |
|---|---|---|---|
| Download |

InfluxDB

Easily monitor InfluxDB, an open source time series database, with Grafana Cloud's out-of-the-box monitoring solution.
Learn more