
Datum Internet Edge
Real-time visibility into Datum Proxy infrastructure. Tracks total HTTP proxies, hostnames, and domains; upstream RPS by region; global response codes and latency percentiles; plus domain and proxy health status. Ideal for quick operational checks and troubleshooting.
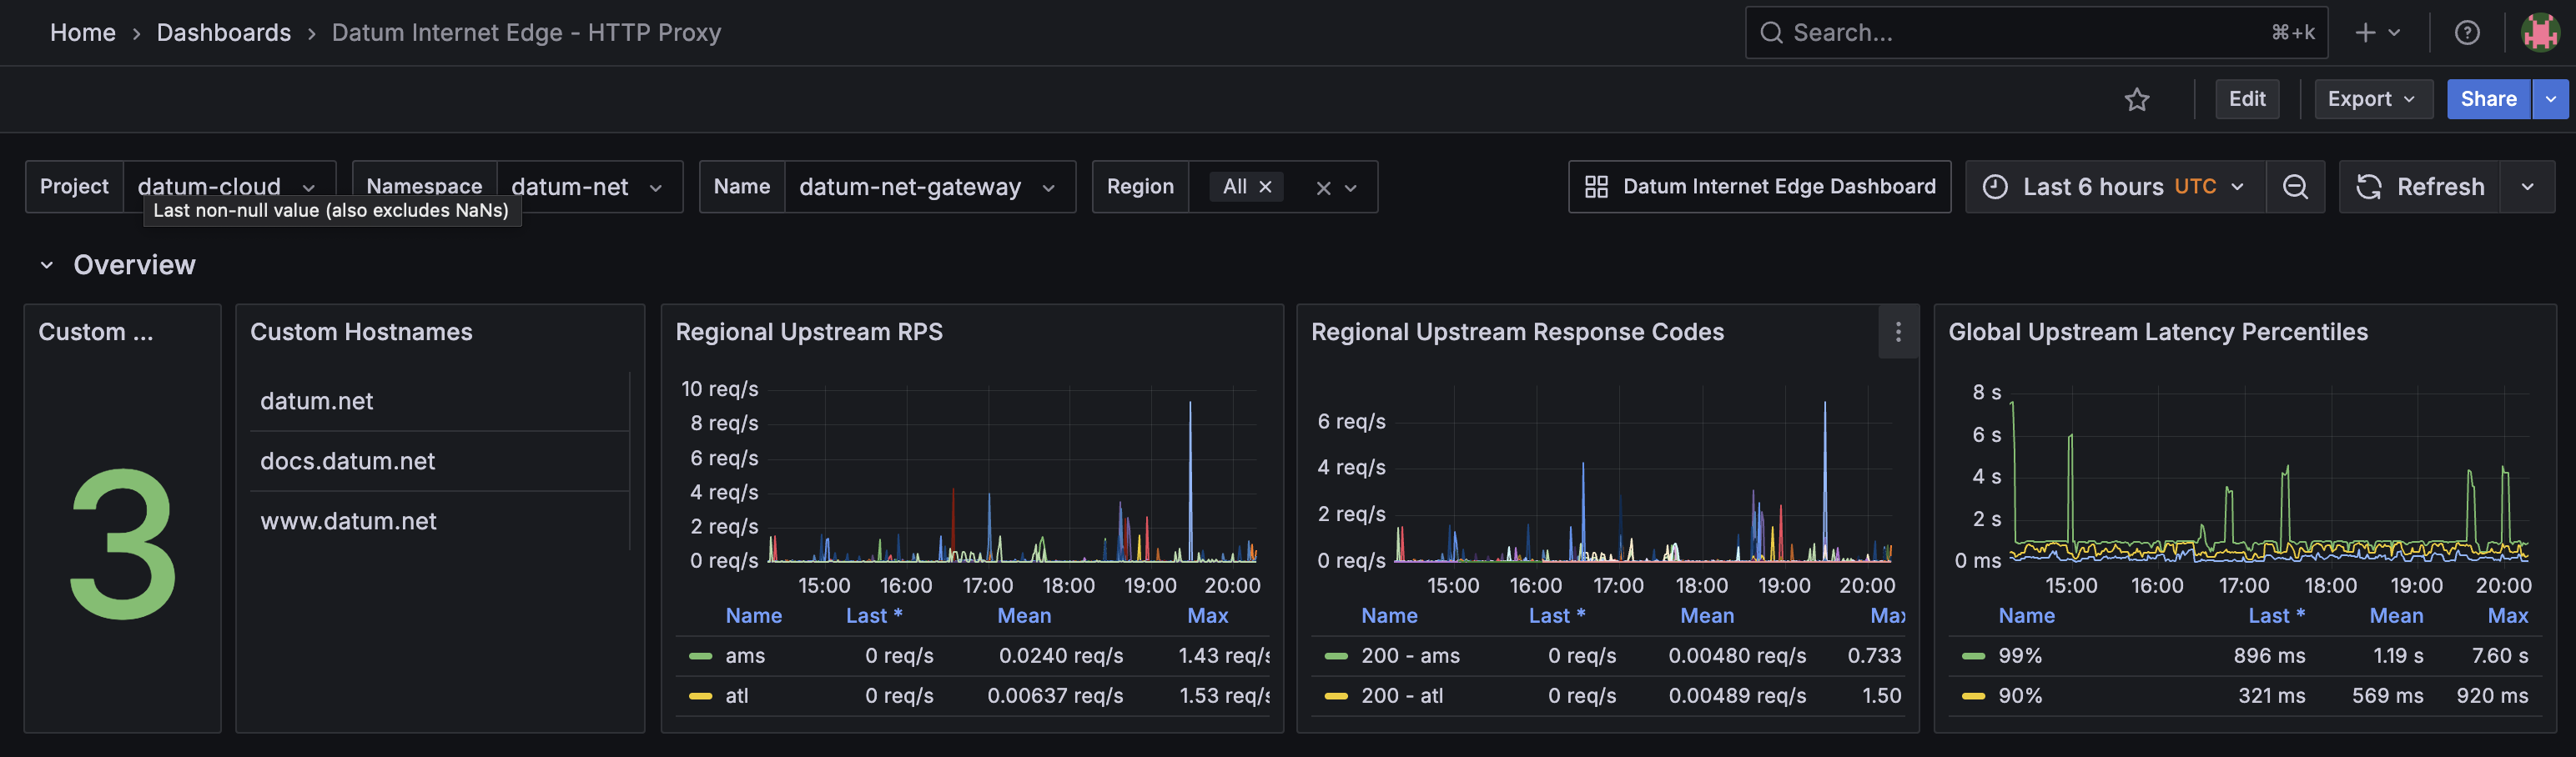
This dashboard serves as an entry point to view the status of Internet Edge resources on Datum Cloud. Data is to be exported from Datum into Prometheus - a tutorial for how to set up an export to Grafana Cloud can be found at https://www.datum.net/docs/tutorials/grafana/
Data source config
Collector type:
Collector plugins:
Collector config:
Revisions
Upload an updated version of an exported dashboard.json file from Grafana
| Revision | Description | Created | |
|---|---|---|---|
| Download |