
Brokkr Monitoring - BMC
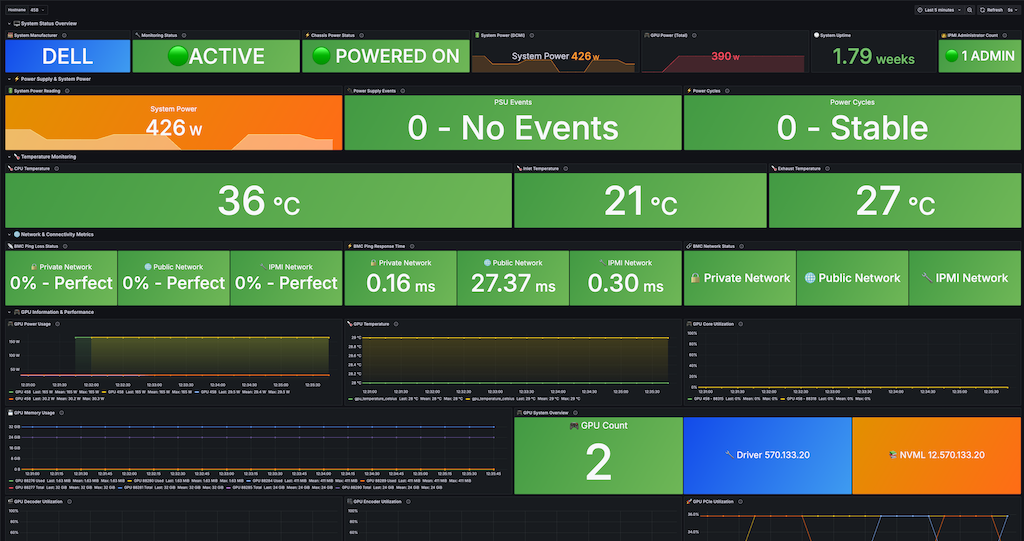
Brokkr Monitoring - Comprehensive BMC Dashboard
A complete monitoring dashboard for bare metal servers with BMC (Baseboard Management Controller) integration, designed for data centers and infrastructure monitoring.
Overview
This dashboard provides comprehensive monitoring for physical servers including:
- System Status & Power Management - Real-time power consumption, chassis status, and uptime monitoring
- Network Connectivity - BMC ping monitoring, response times, and network interface status
- Power Supply Monitoring - Voltage rails, power supply events, and fault detection
- Temperature Monitoring - CPU, inlet, exhaust, and GPU temperature sensors with thermal alerts
- Fan Monitoring - Fan RPM tracking across all fan zones with fault detection
- GPU Performance - Complete GPU metrics including power, temperature, utilization, bandwidth, and precision workload activity
- Drive & NIC Health - NVMe/SMART drive health, unsafe shutdown tracking, and network interface status per host
Data Sources
- Primary: Prometheus/Thanos
- Metrics Source: IPMI sensors, BMC monitoring agents, GPU telemetry, drive SMART data
- Collection: Hardware sensors and system monitoring agents
Key Features
🖥️ System Overview
- System manufacturer detection
- Agent monitoring status
- Chassis power state (ON/OFF)
- IPMI administrator user count
- Hosts reporting count
- Total chassis power
- Average inlet / max exhaust temperature at-a-glance
- Active sensor count and sensor warning/critical summary
⚡ Power Supply & System Power
- Real-time power readings (watts)
- Power supply event tracking
- Healthy power supply count
- Voltage rail monitoring
- Power fault status
🌡️ Thermal Management
- Inlet temperature (ambient air)
- Exhaust temperature (cooling efficiency)
- System and GPU temperature
- Other hardware-agnostic temperature sensors
🌀 Fan Monitoring
- Fan RPM across four zones (fans 1-5, 6-10, 11-15, 16-25)
- Cooling fan fault status
🌐 Network Monitoring
- BMC ping loss percentage (private, public, and IPMI network paths)
- BMC ping response time (private, public, and IPMI network paths)
- IPMI BMC, private, and public network interface status
🎮 GPU Monitoring
- GPU power usage
- GPU temperature
- GPU core utilization and operating frequency
- PCIe bandwidth (RX/TX)
- NVLink bandwidth (RX/TX)
- FP16 / FP32 / FP64 activity
- GPU core voltage
💾 Drive & NIC Health
- Host-level fault detection (chassis intrusion, drive faults)
- Count of hosts with drive issues, SMART warnings, or media errors
- Average NVMe life remaining
- NIC-down count
- Total unsafe shutdown count
- SMART available spare and NVMe life left, broken down by host
- NVMe drive temperature by host
Dashboard Variables
- hostname: Select target server(s) for monitoring
- Automatically detects available hosts with monitoring data
- Used to filter every panel in the dashboard to the selected host(s)
Metric Examples
System power consumption
bmc_chassis_power_watts{hostname=~"$hostname"}
BMC network reachability
icmp_loss_private_address_api{hostname=~"$hostname"}
GPU temperature
gpu_temperature_celsius{hostname=~"$hostname"}
Inlet temperature
bmc_inlet_temperature_celsius{hostname=~"$hostname"}
NVMe drive life remaining
drive_life_left_percent{drive="NVMe.*", hostname="$hostname"}
Alerts & Thresholds
Thresholds vary by panel rather than following a single fixed scale. A few representative examples:
Power (Power Readings panel)
- Green: 0-3000W
- Yellow: 3000-4000W
- Orange: 4000-5000W
- Red: > 5000W
Temperature (most timeseries panels)
- Green: 0-80°C
- Red: > 80°C
Temperature (GPU Temperature stat panel)
- Green: 0-65°C
- Yellow: 65-75°C
- Orange: 75-85°C
- Red: > 85°C
NVMe Drive Temperature
- Green: 0-46°C
- Yellow: 46-71°C
- Red: > 71°C
Network (ping loss / response time gauges)
- Thresholds are set as a percentage of each gauge's configured range (green below 60%, yellow 60-80%, red above 80%), rather than fixed packet-loss or latency values. Adjust the gauge max/thresholds to match your network's expected baseline.
Requirements
- Grafana 11.0+ (dashboard schema version 42)
- Prometheus/Thanos data source
- BMC/IPMI enabled servers with monitoring agents
- GPU monitoring (optional - GPU panels will show no data if unavailable)
Installation
- Import the JSON dashboard file into Grafana
- Configure your Prometheus/Thanos data source
- Update the data source UID to match your environment
- Set up the hostname variable to match your server naming convention
- Adjust refresh rate and time range if the 15-minute defaults don't suit your environment
Supported Hardware
- Cross-platform: Dell, HP, Supermicro, and other BMC-enabled servers
- GPUs: NVIDIA GPUs with NVML support
- Networks: Standard ethernet interfaces (eno1, eno2, eno3, etc.)
- IPMI: Standard IPMI 2.0 compatible BMCs
Use Cases
- Data Center Monitoring: Real-time infrastructure health
- GPU Cluster Management: AI/ML workload monitoring
- Thermal Management: Cooling system optimization
- Power Management: Energy consumption tracking
- Network Monitoring: Connectivity and performance tracking
- Drive Health: Proactive NVMe/SMART maintenance and unsafe-shutdown tracking
Dashboard Sections
- System Status Overview - At-a-glance system health
- Network & Connectivity Metrics - Network performance
- Power Supply & System Power - Energy consumption monitoring
- Temperature Monitoring - Thermal management
- Fan Monitoring - Fan RPM and cooling fault detection
- GPU Information & Performance - Complete GPU telemetry
- Host Information - NVMe/SMART drive health and NIC status by host
Configuration Notes
- Auto-refresh: Set to 15 minutes by default
- Time Range: Default last 15 minutes (adjustable)
- Variables: Hostname selection auto-populates from available metrics
- Thresholds: Configured per panel; see Alerts & Thresholds above for representative values
- Colors: Green/Yellow/Orange/Red (or Green/Red, depending on panel) system for quick health assessment
Data source config
Collector config:
Upload an updated version of an exported dashboard.json file from Grafana
| Revision | Description | Created | |
|---|---|---|---|
| Download |