Goma Gateway Observability Dashboard
Visualize Goma Gateway metrics
Goma Gateway Observability Dashboard
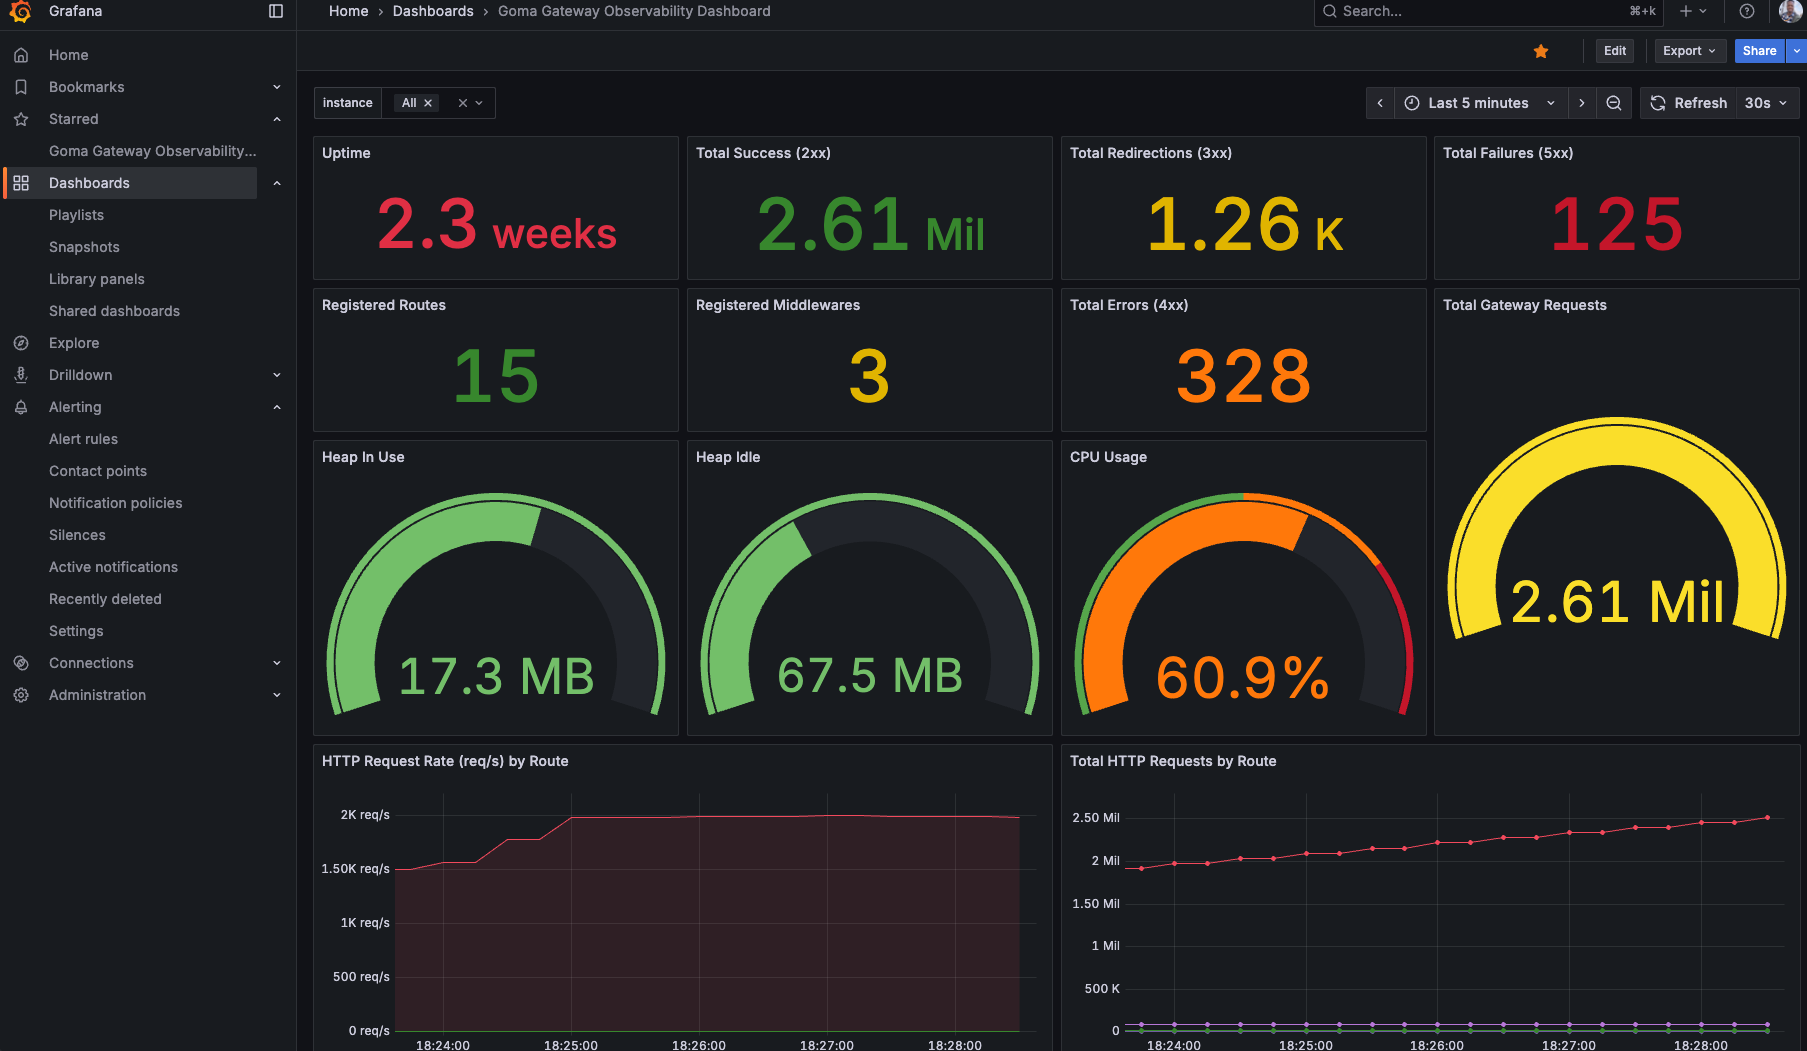
This dashboard provides comprehensive insights into your Goma Gateway instance. It helps you monitor and analyze:
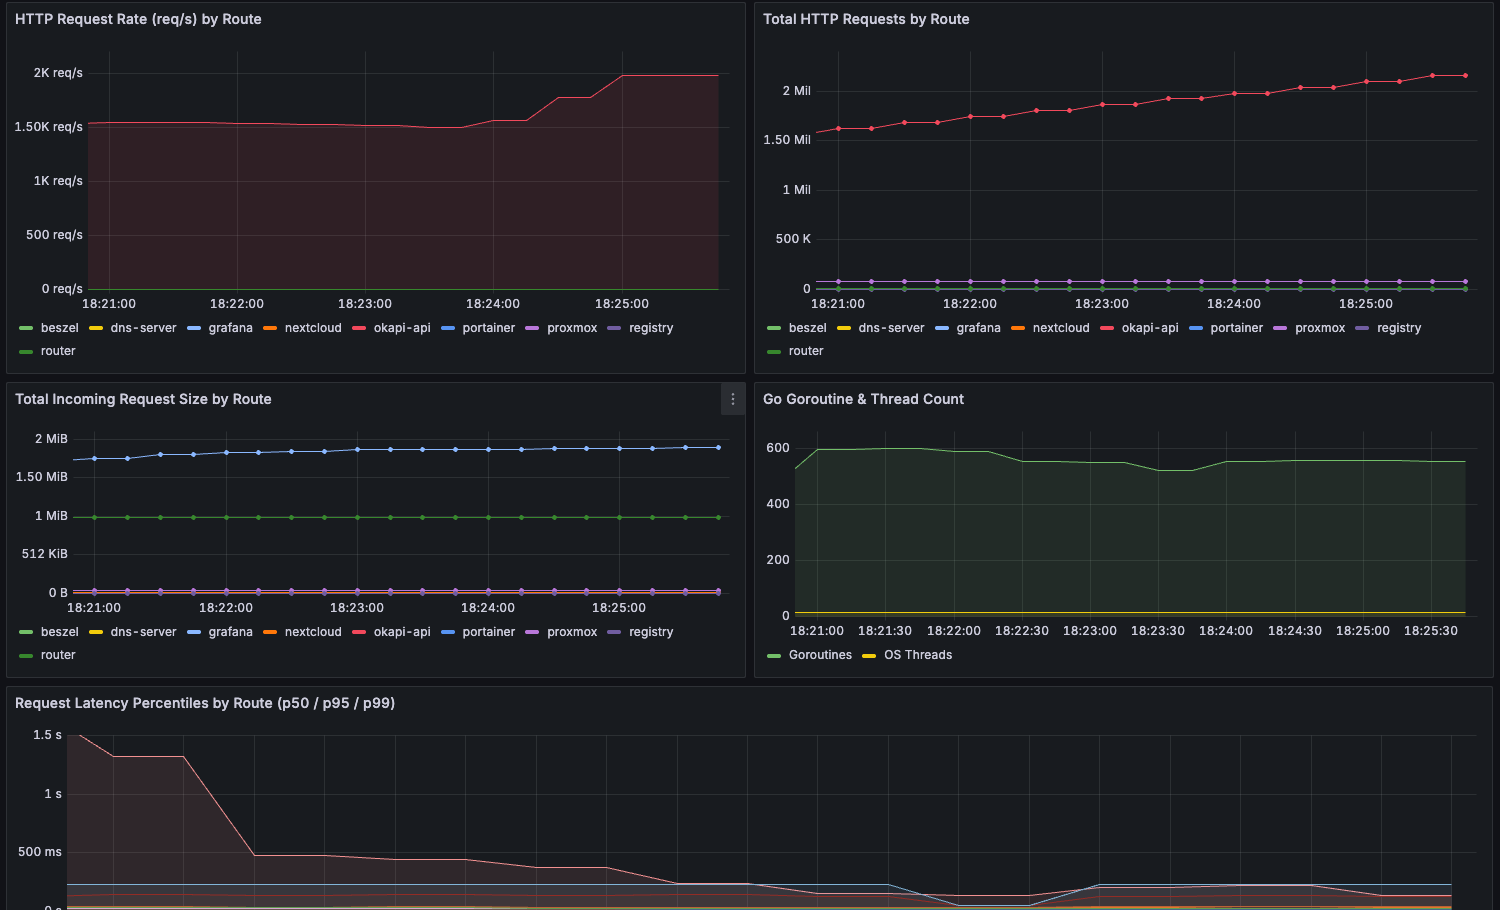
- HTTP request volume and rates
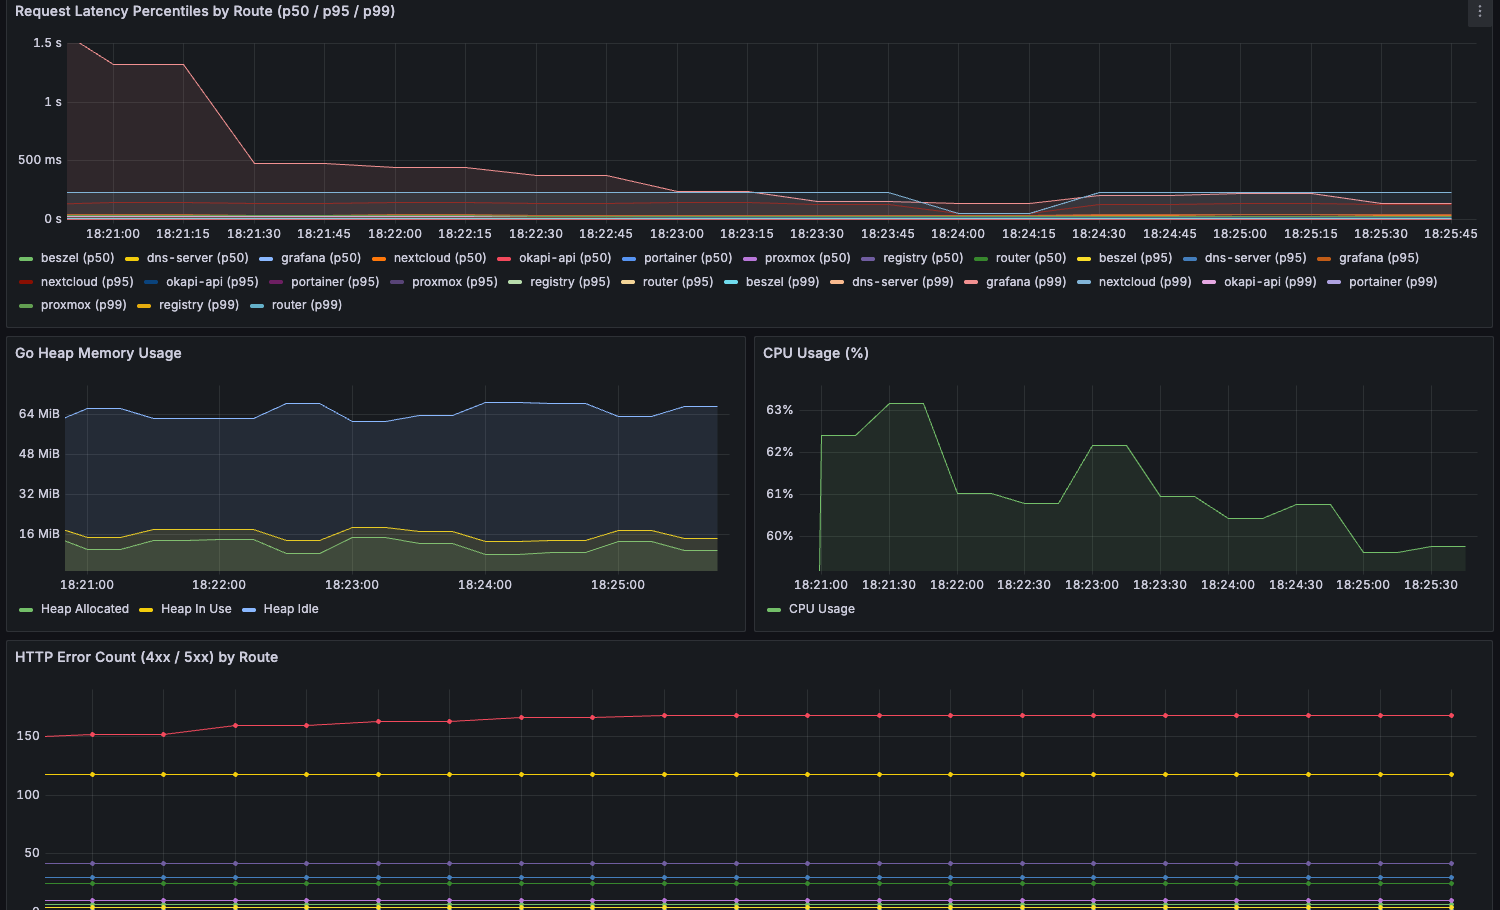
- Request latency (p50, p95, p99 percentiles)
- Active routes and middleware count
- Response status breakdown (2xx, 4xx, 5xx)
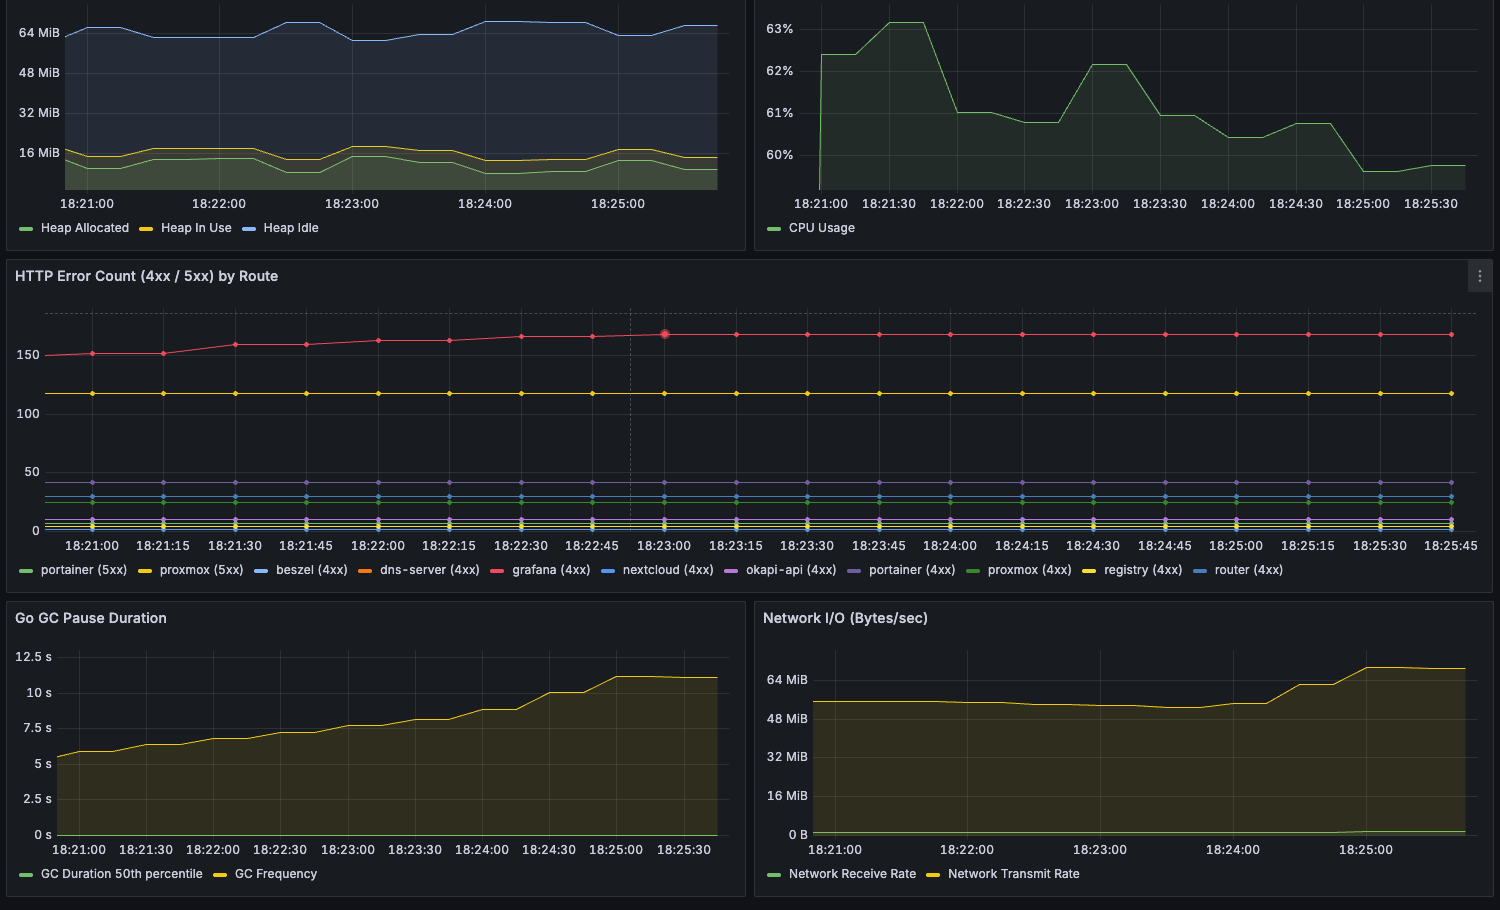
- Go runtime metrics (CPU, memory, GC, goroutines)
- Network throughput and system-level metrics
Built to support performance tuning, debugging, and production monitoring of modern API Gateway deployments.
Data source config
Collector type:
Collector plugins:
Collector config:
Revisions
Upload an updated version of an exported dashboard.json file from Grafana
| Revision | Description | Created | |
|---|---|---|---|
| Download |