
qBittorrent
A comprehensive Grafana dashboard to visualize qBittorrent activity and performance metrics — including global download/upload speeds, torrent states, connection status, peer ratios, and tracker statistics. Perfect for real-time torrent monitoring.
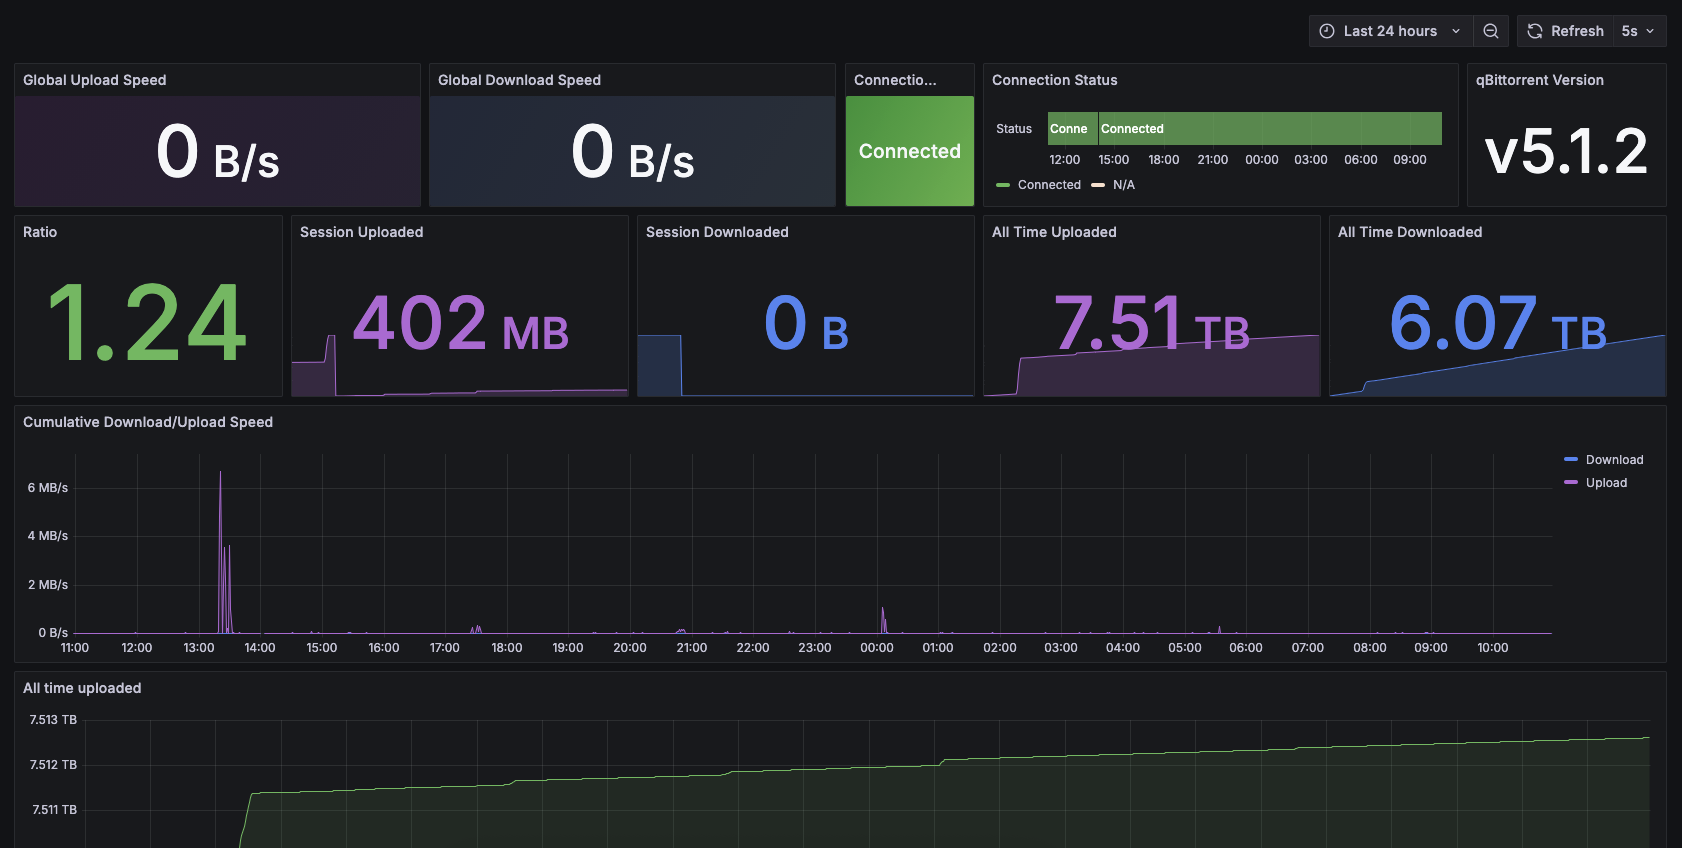
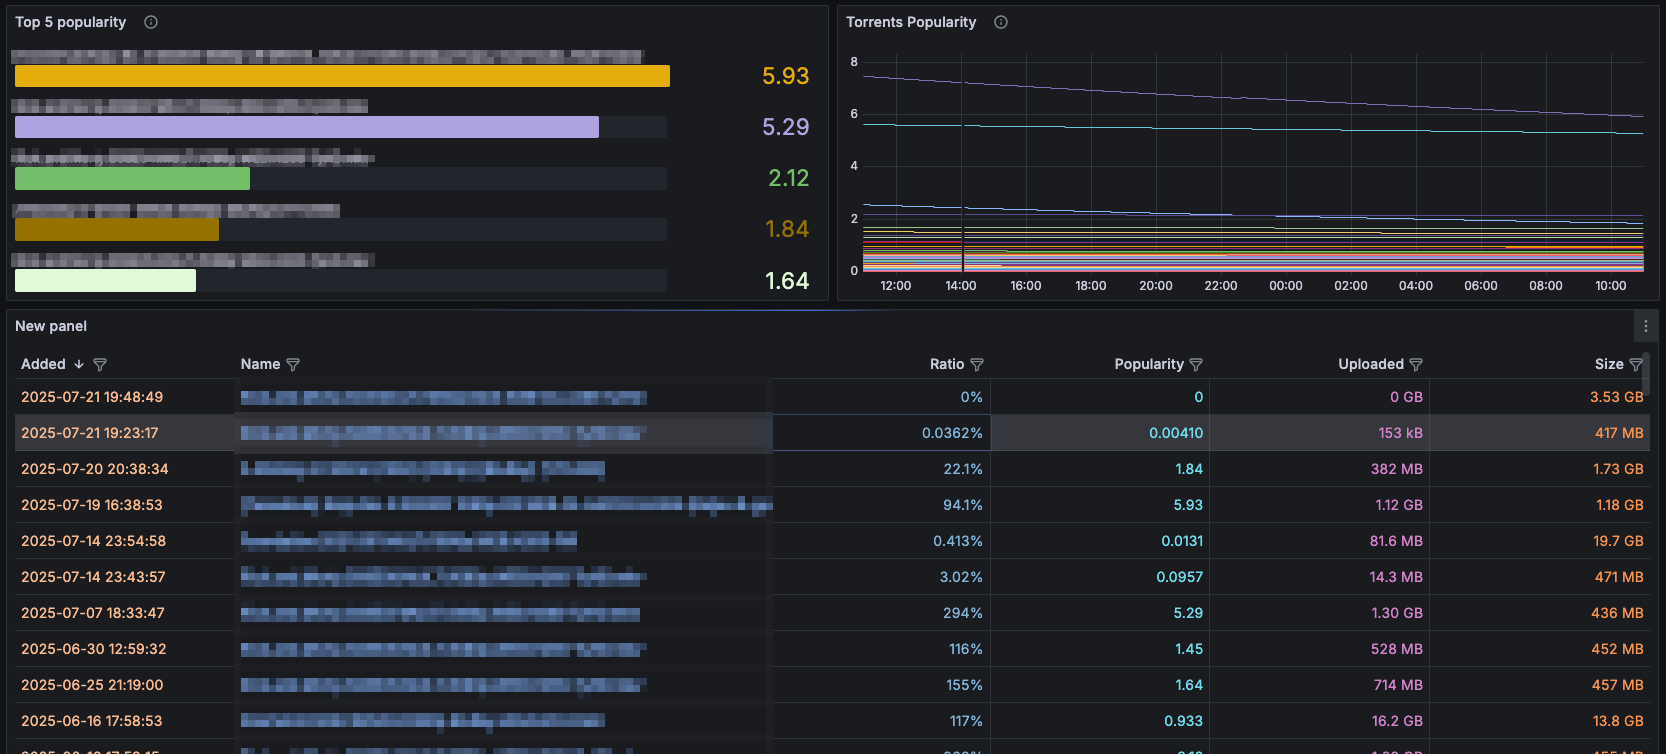
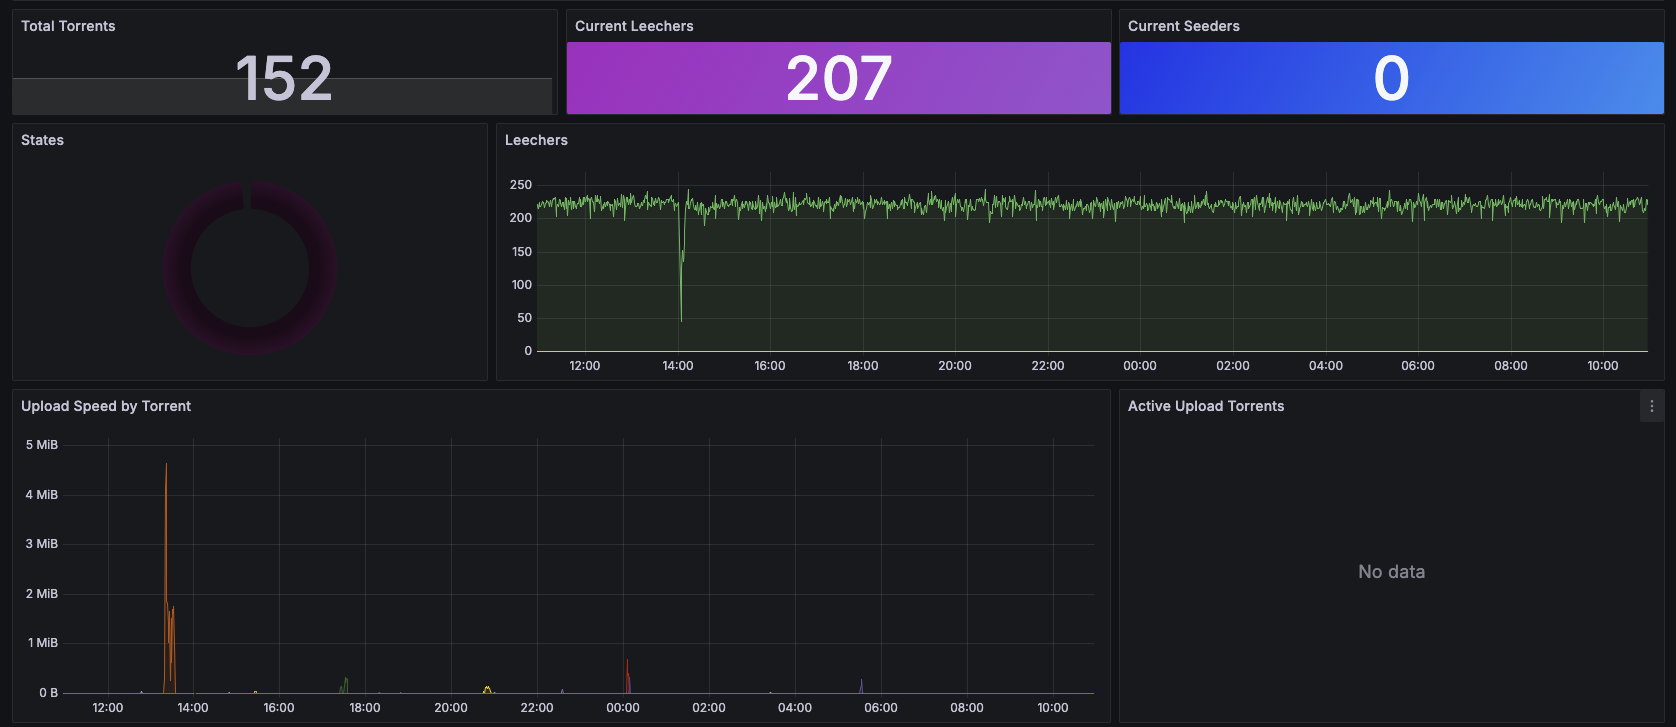
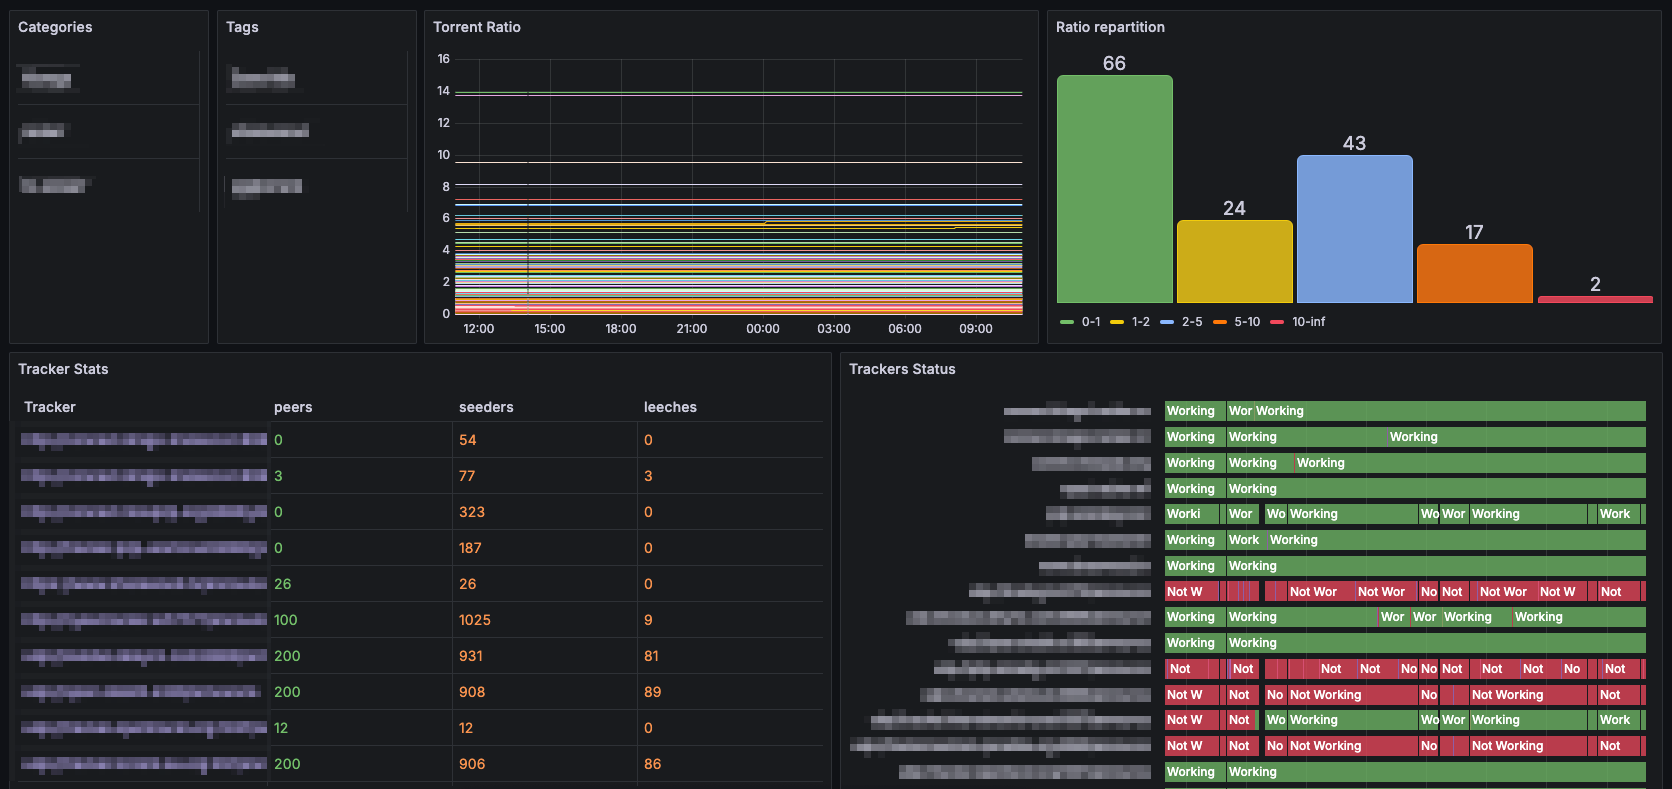
📊 qBittorrent Grafana Dashboard
This Grafana dashboard provides a complete and real-time visualization of your qBittorrent activity using data exposed via the martabal/qbittorrent-exporter for Prometheus.
🎯 Purpose
Monitor and analyze your qBittorrent client metrics at a glance:
- Network throughput (download/upload)
- Torrent activity and status
- Peer statistics (seeders/leechers)
- Tracker health
- Torrent ratios and session stats
- Top performing torrents by popularity
🛠️ Requirements
- qBittorrent running with WebUI enabled
- Prometheus configured to scrape
qbittorrent-exporter - Grafana 8+ (tested on 12.x)
martabal/qbittorrent-exporter
📦 Panels Overview
This dashboard includes the following panels:
- Global Upload Speed
- Global Download Speed
- Connection Status
- qBittorrent Version
- All-Time Uploaded & Downloaded Data
- Session Upload & Download Stats
- Torrent Ratio & Repartition
- Cumulative Upload/Download Speed Graph
- Torrent States (Pie Chart)
- Active Uploading Torrents (Table)
- Download/Upload Speed by Torrent
- Top 5 Popular Torrents
- Leechers & Seeders Stats
- Total Torrents Count
- Tracker Stats and Status
- Categories and Tags
🔗 References
- 📦 Exporter Repo: martabal/qbittorrent-exporter
- 📘 qBittorrent: https://www.qbittorrent.org
- 📈 Grafana: https://grafana.com
- 📊 Prometheus: https://prometheus.io
Enjoy clean and powerful torrent monitoring! 🚀
Data source config
Collector type:
Collector plugins:
Collector config:
Revisions
Upload an updated version of an exported dashboard.json file from Grafana
| Revision | Description | Created | |
|---|---|---|---|
| Download |