Azure Managed Grafana Usage Insights
Dashboard that visualizes Azure Managed Grafana usage diagnostics—tracking unique user logins, dashboard view counts, and data query activity over time—with filters for subscription, workspace, instance, users, dashboards, and a configurable Top N.
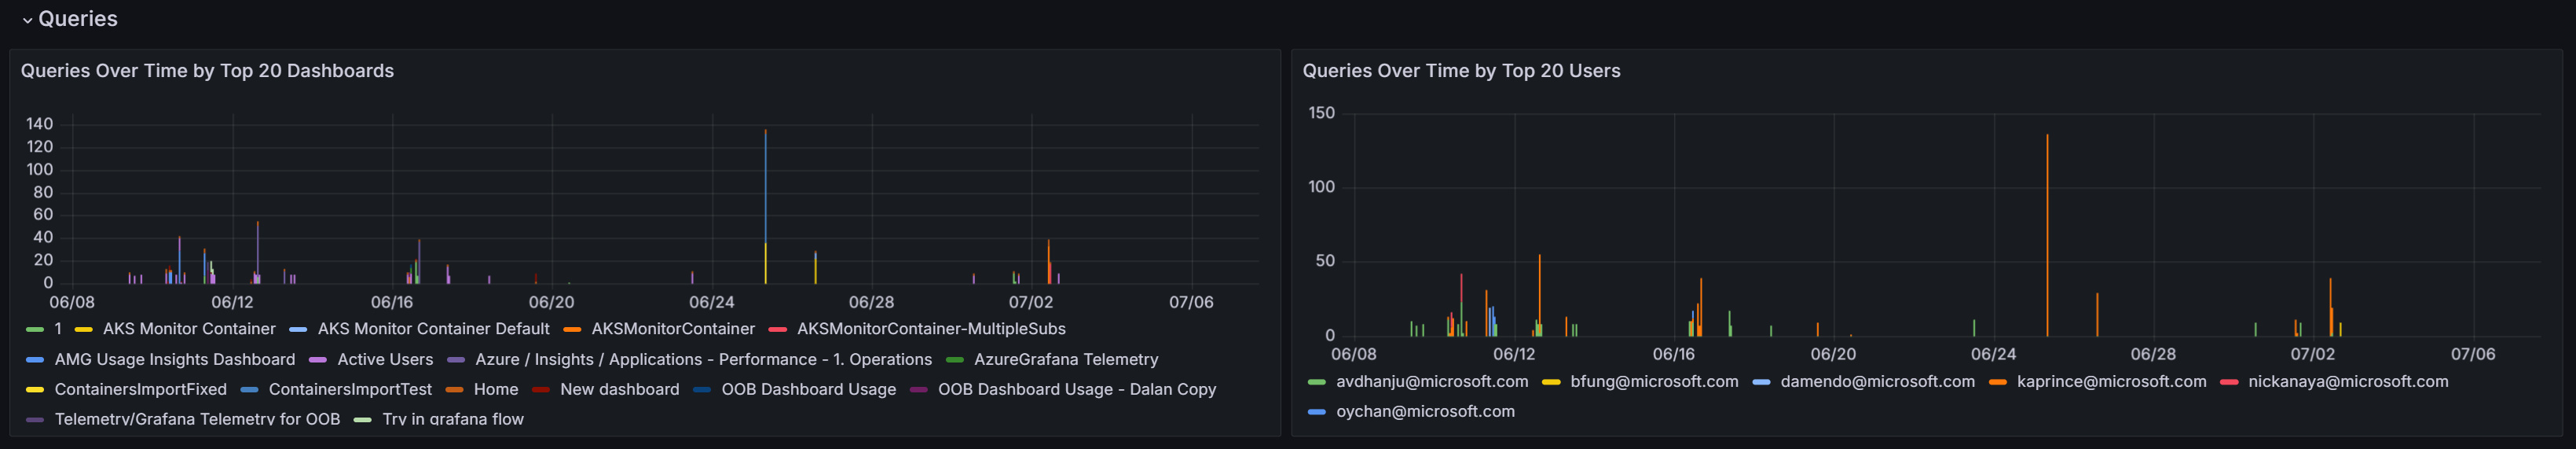
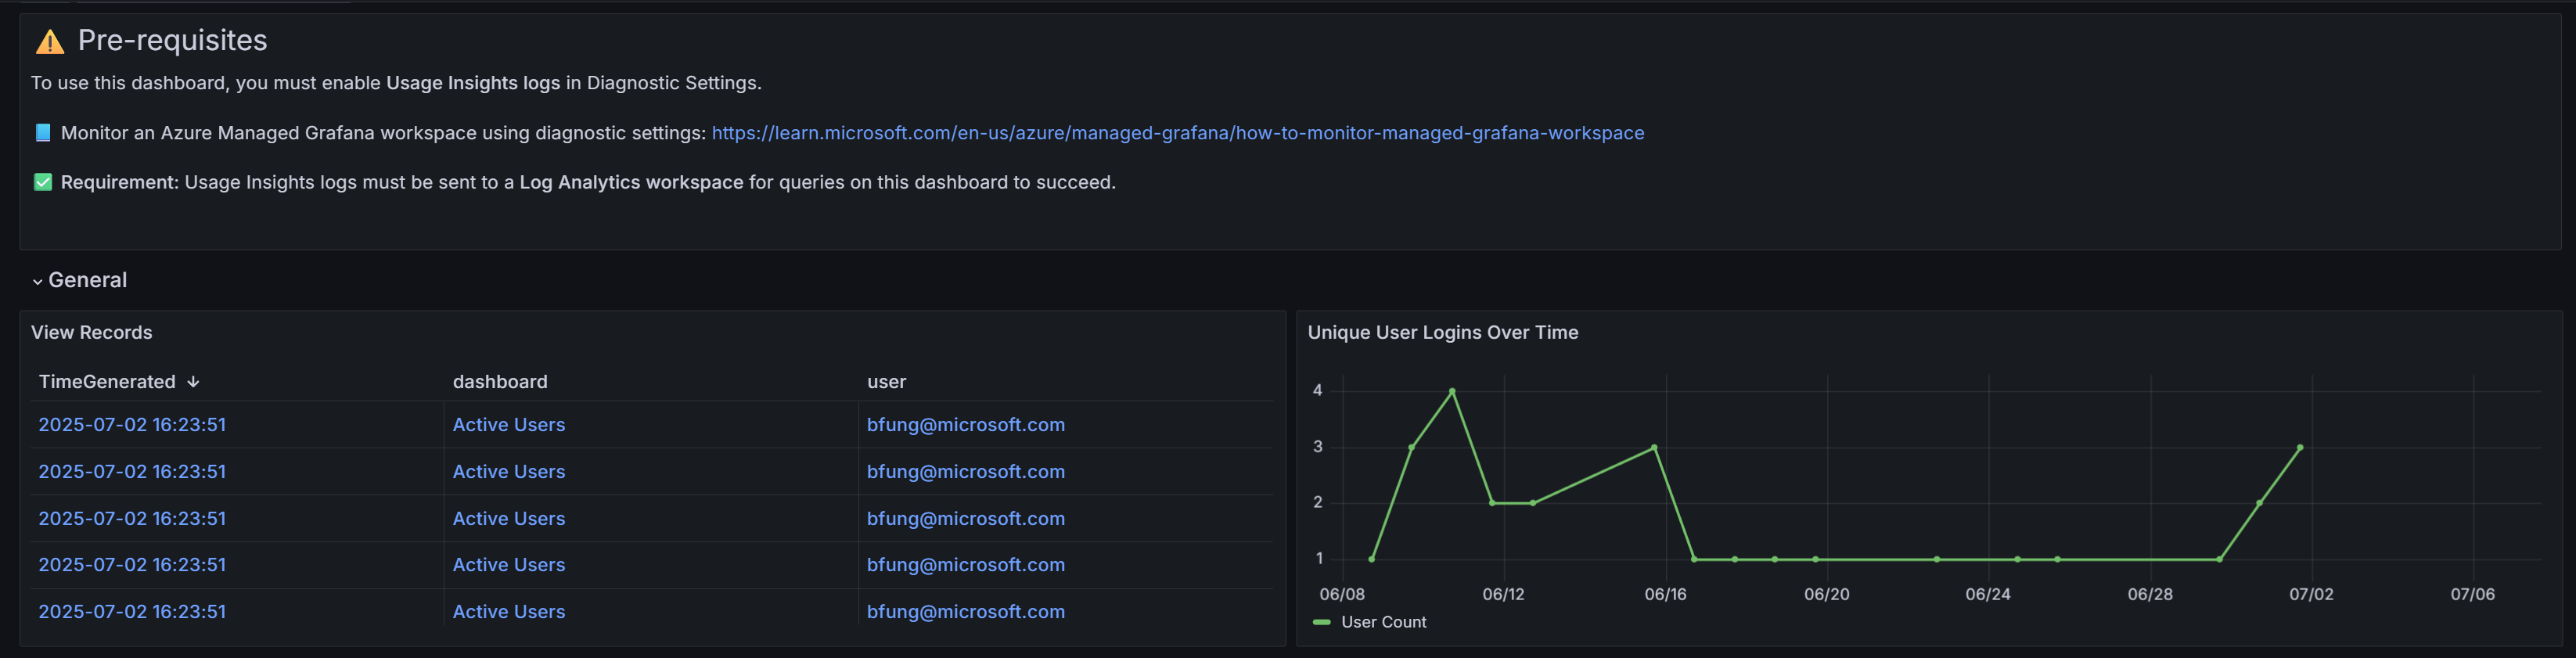
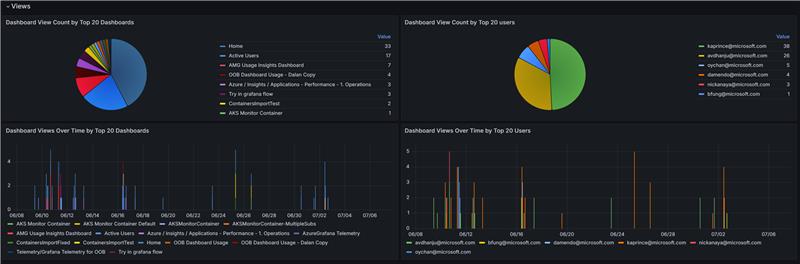
The Azure Managed Grafana Usage Insights dashboard uses the grafana-azure-monitor-datasource data source to create a Grafana dashboard with the piechart, table, text and timeseries panels.
Data source config
Collector type:
Collector plugins:
Collector config:
Revisions
Upload an updated version of an exported dashboard.json file from Grafana
| Revision | Description | Created | |
|---|---|---|---|
| Download |
Azure Cosmos DB
With the Grafana plugin for Azure Cosmos DB, you can quickly visualize and query your Azure Cosmos DB data from within Grafana.
Learn more