Grafana Dashboard for Veeam ONE Overview - Protected Workloads
Grafana Dashboard with the ultimate level of visibility for Veeam Data Platform. It uses the truly comprehensive and feature-rich Veeam ONE APIs. This view is Protected Workloads
Attention - This Dashboard has been built for InfluxDB v2.0 using Flux
Requires Veeam Data Protection Advanced licensing
Just download the latest Veeam ONE OVerview script version from GitHub https://raw.githubusercontent.com/jorgedlcruz/veeam-one-grafana/refs/heads/main/veeam_one_overview.sh and change the Configuration section within your details:
# Configurations
##
# Endpoint URL for InfluxDB
veeamInfluxDBURL="YOURINFLUXSERVER" #Your InfluxDB Server, http://FQDN or https://FQDN if using SSL
veeamInfluxDBPort="8086" #Default Port
veeamInfluxDBBucket="YOURINFLUXDB" # InfluxDB bucket name (not ID)
veeamInfluxDBToken="TOKEN" # InfluxDB access token with read/write privileges for the bucket
veeamInfluxDBOrg="ORG NAME" # InfluxDB organisation name (not ID)
Endpoint URL for login action
veeamUsername="YOURVEEAMONEUSER" #Usually domain\user or user@domain.tld
veeamPassword="YOURVEEAMONEPASS"
veeamONEServer="https://YOURVEEAMONEIP" #You can use FQDN if you like as well
veeamONEPort="1239" #Default Port
Once the changes are done, make the script executable with chmod:
chmod +x veeam_one_overview.sh
The output of the command should be something like the next, without errors:
Writing veeam_ONE_about to InfluxDB
Writing veeam_ONE_overview_protectedvms data to InfluxDB
Writing veeam_ONE_overview_protectedvms data to InfluxDB
Writing veeam_ONE_overview_protectedvms data to InfluxDB
Writing veeam_ONE_overview_protectedvms data to InfluxDB
Writing veeam_ONE_overview_protectedvms data to InfluxDB
Writing veeam_ONE_overview_protectedvms data to InfluxDB
Writing veeam_ONE_overview_protectedvms data to InfluxDB
Writing veeam_ONE_overview_protectedvms data to InfluxDB
Writing veeam_ONE_overview_protectedvms data to InfluxDB
Writing veeam_ONE_overview_protectedvms data to InfluxDB
If so, please now add this script to your crontab, like for example every 60 minutes:
*/60 * * * * * /home/oper/veeam_one_overview.sh >> /var/log/veeam_one_overview.log 2>&1
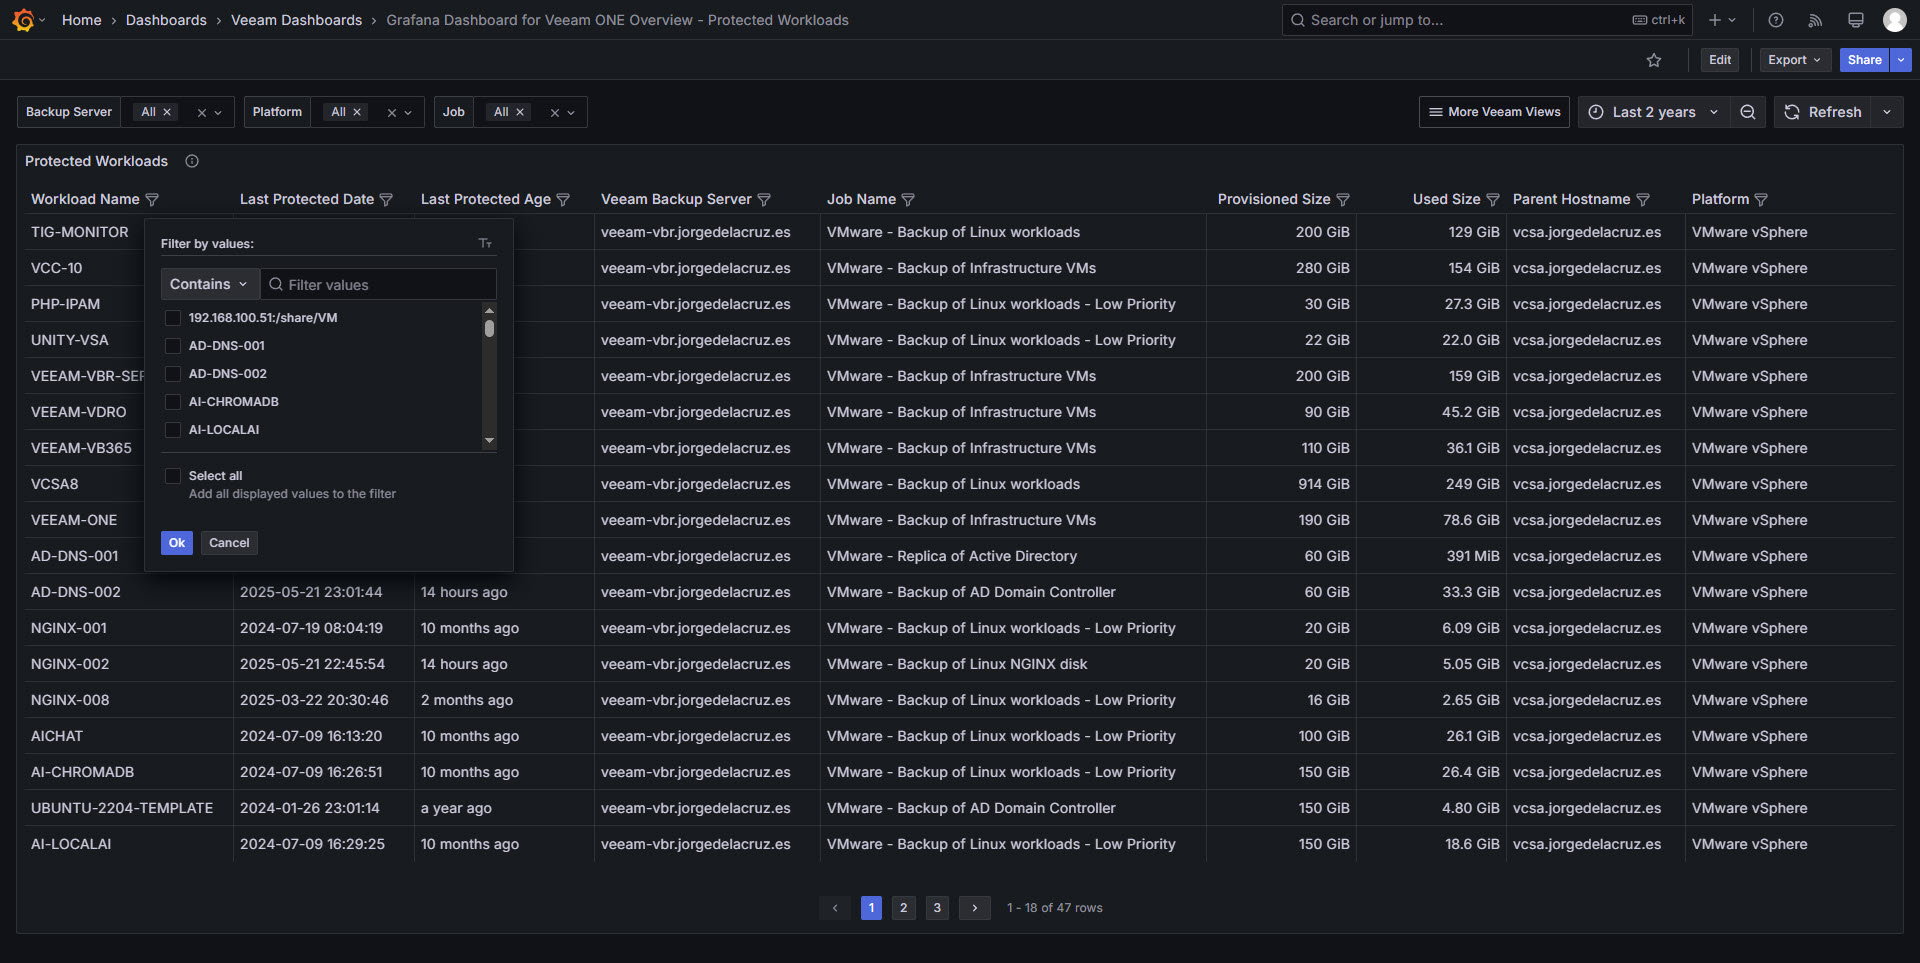
Then download or import this Dashboard to your Grafana, and you should see something similar to the next:

Data source config
Collector config:
Upload an updated version of an exported dashboard.json file from Grafana
| Revision | Description | Created | |
|---|---|---|---|
| Download |