Aerospike Kubernetes Operator View
This dashboard visualizes the controller-runtime and workqueue metrics. It provides insights into the performance, behavior, and reconciliation efficiency of the Aerospike Operator.
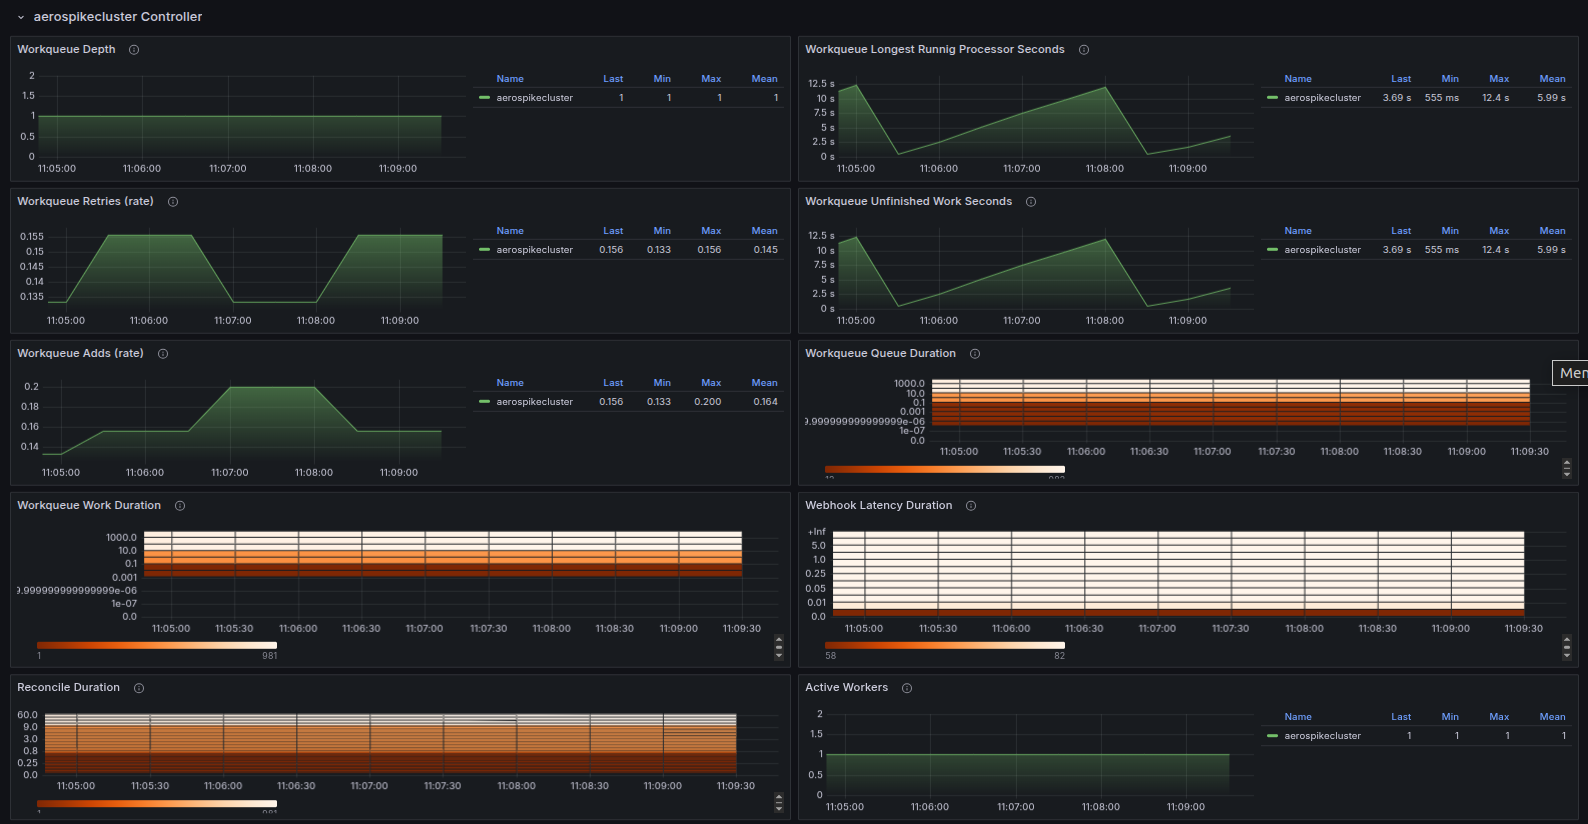
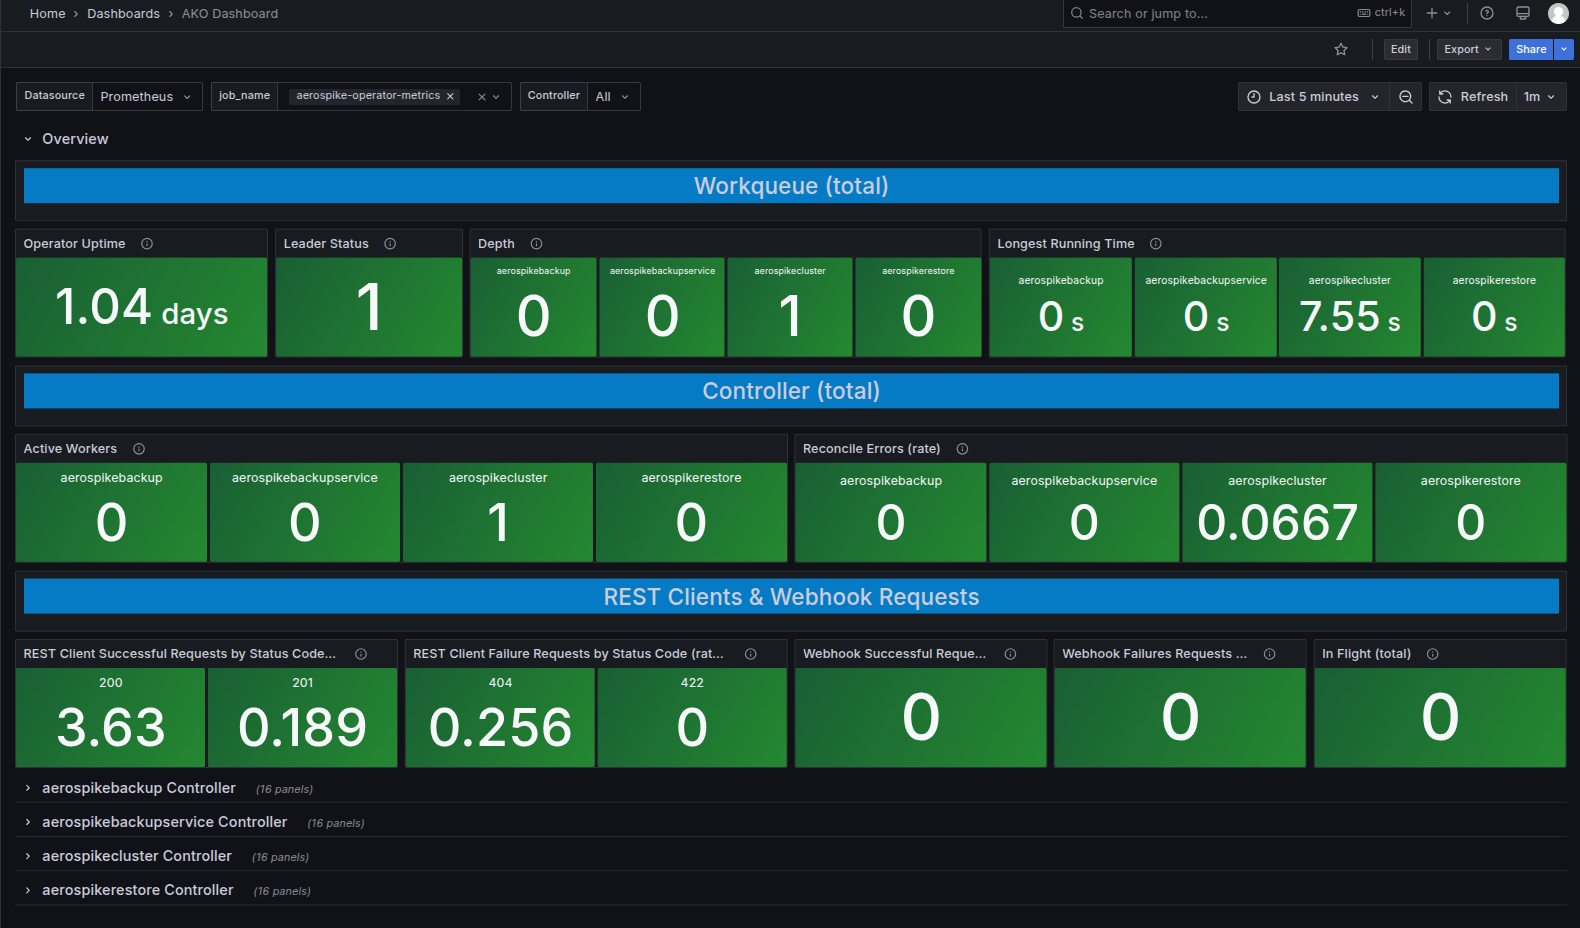

This dashboard collates various critical Aerospike Kubernetes controller-runtime and workqueue metrics.
Aerospike's Monitoring Stack extracts operational metrics from Aerospike database clusters for visualization and analysis in Prometheus and Grafana.
See Aerospike Monitoring Stack Architecture and Aerospike Monitoring Stack Installation for more details
Data source config
Collector config:
Upload an updated version of an exported dashboard.json file from Grafana
| Revision | Description | Created | |
|---|---|---|---|
| Download |
Kubernetes
Monitor your Kubernetes deployment with prebuilt visualizations that allow you to drill down from a high-level cluster overview to pod-specific details in minutes.
Learn more