Dashboard Linux Server zabbix
This dashboard provides a comprehensive view of the system’s resource usage, including memory, CPU, disk, network activity, and system uptime. It is designed to help administrators monitor system health, detect performance bottlenecks, and ensure stable long-term operation. Ideal for keeping track of server performance and identifying potential issues early.
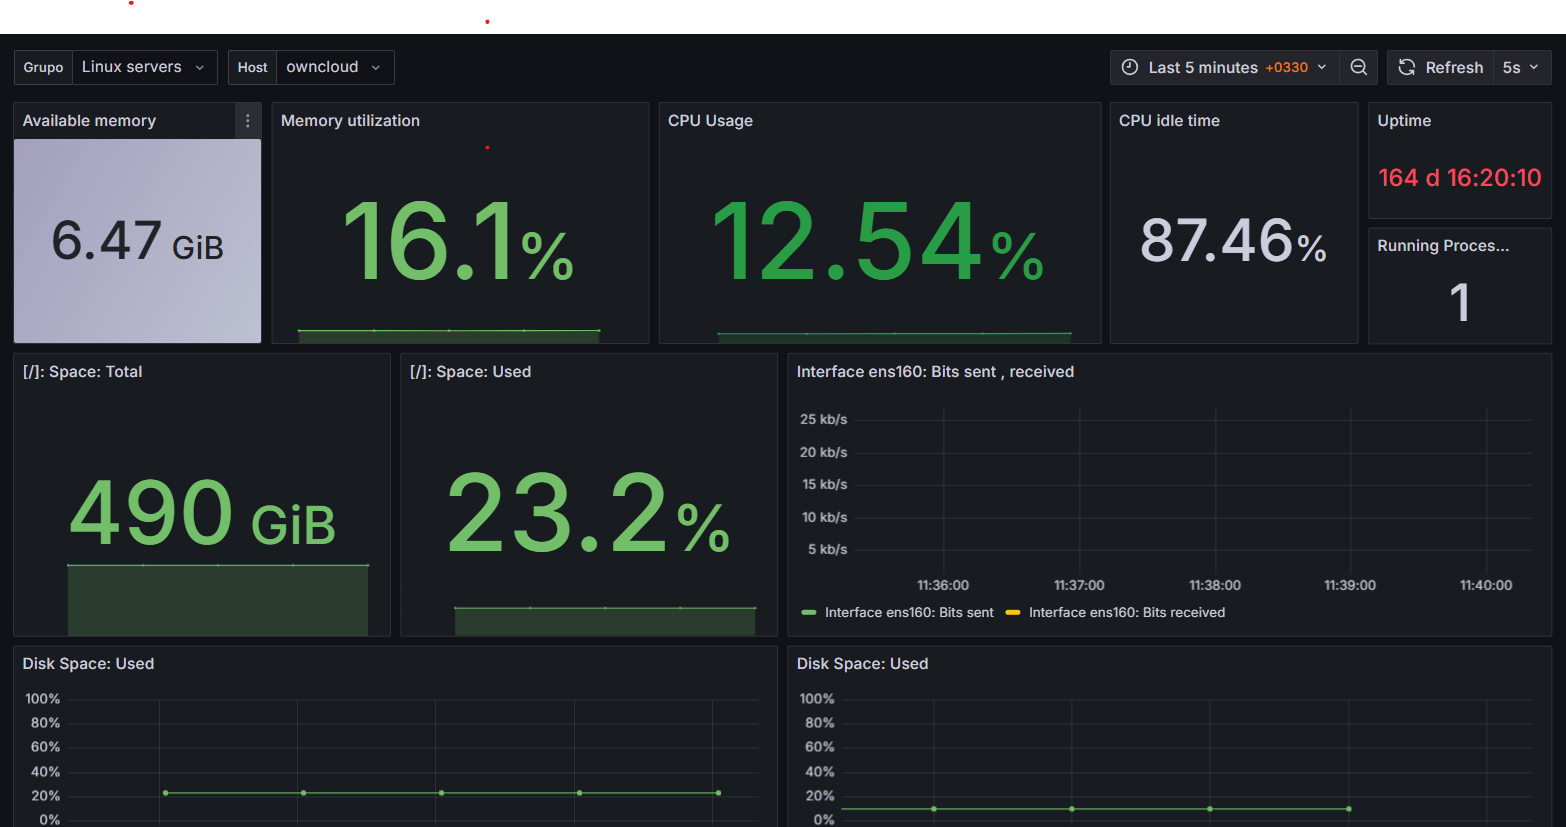
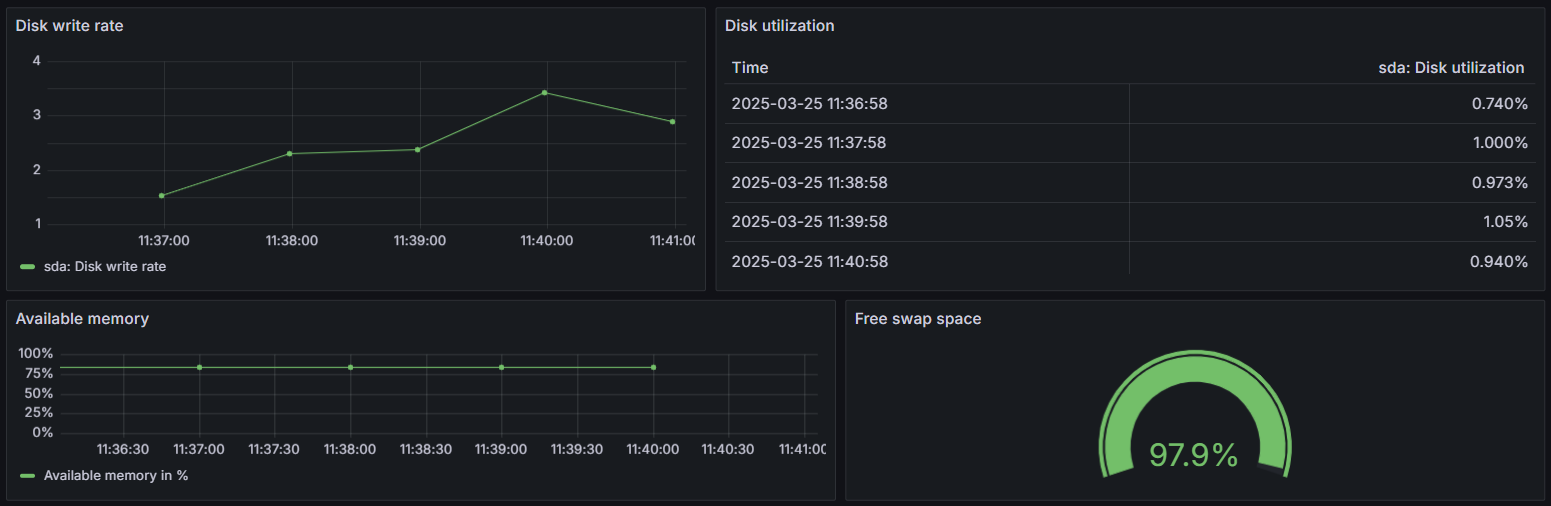
The Dashboard Linux Server zabbix dashboard uses the alexanderzobnin-zabbix-datasource data source to create a Grafana dashboard with the gauge, stat, table and timeseries panels.
Data source config
Collector type:
Collector plugins:
Collector config:
Revisions
Upload an updated version of an exported dashboard.json file from Grafana
| Revision | Description | Created | |
|---|---|---|---|
| Download |
Linux Server
Monitor Linux with Grafana. Easily monitor your Linux deployment with Grafana Cloud's out-of-the-box monitoring solution.
Learn more