
Imua Dashboard by Cumulo
This dashboard provides a comprehensive overview of the health and performance of a Imua blockchain node. It monitors sync status, consensus metrics, block processing times, transaction activity, validator participation, and system resource usage. The dashboard helps identify network issues, node performance bottlenecks, and memory management efficiency, offering critical insights for maintaining an optimized and healthy node. For detailed documentation of the metrics, visit: https://github.com/Cumulo-pro/ExocoreTools/blob/main/monitoring/exocore_metrics.md#block-interval-time-sum
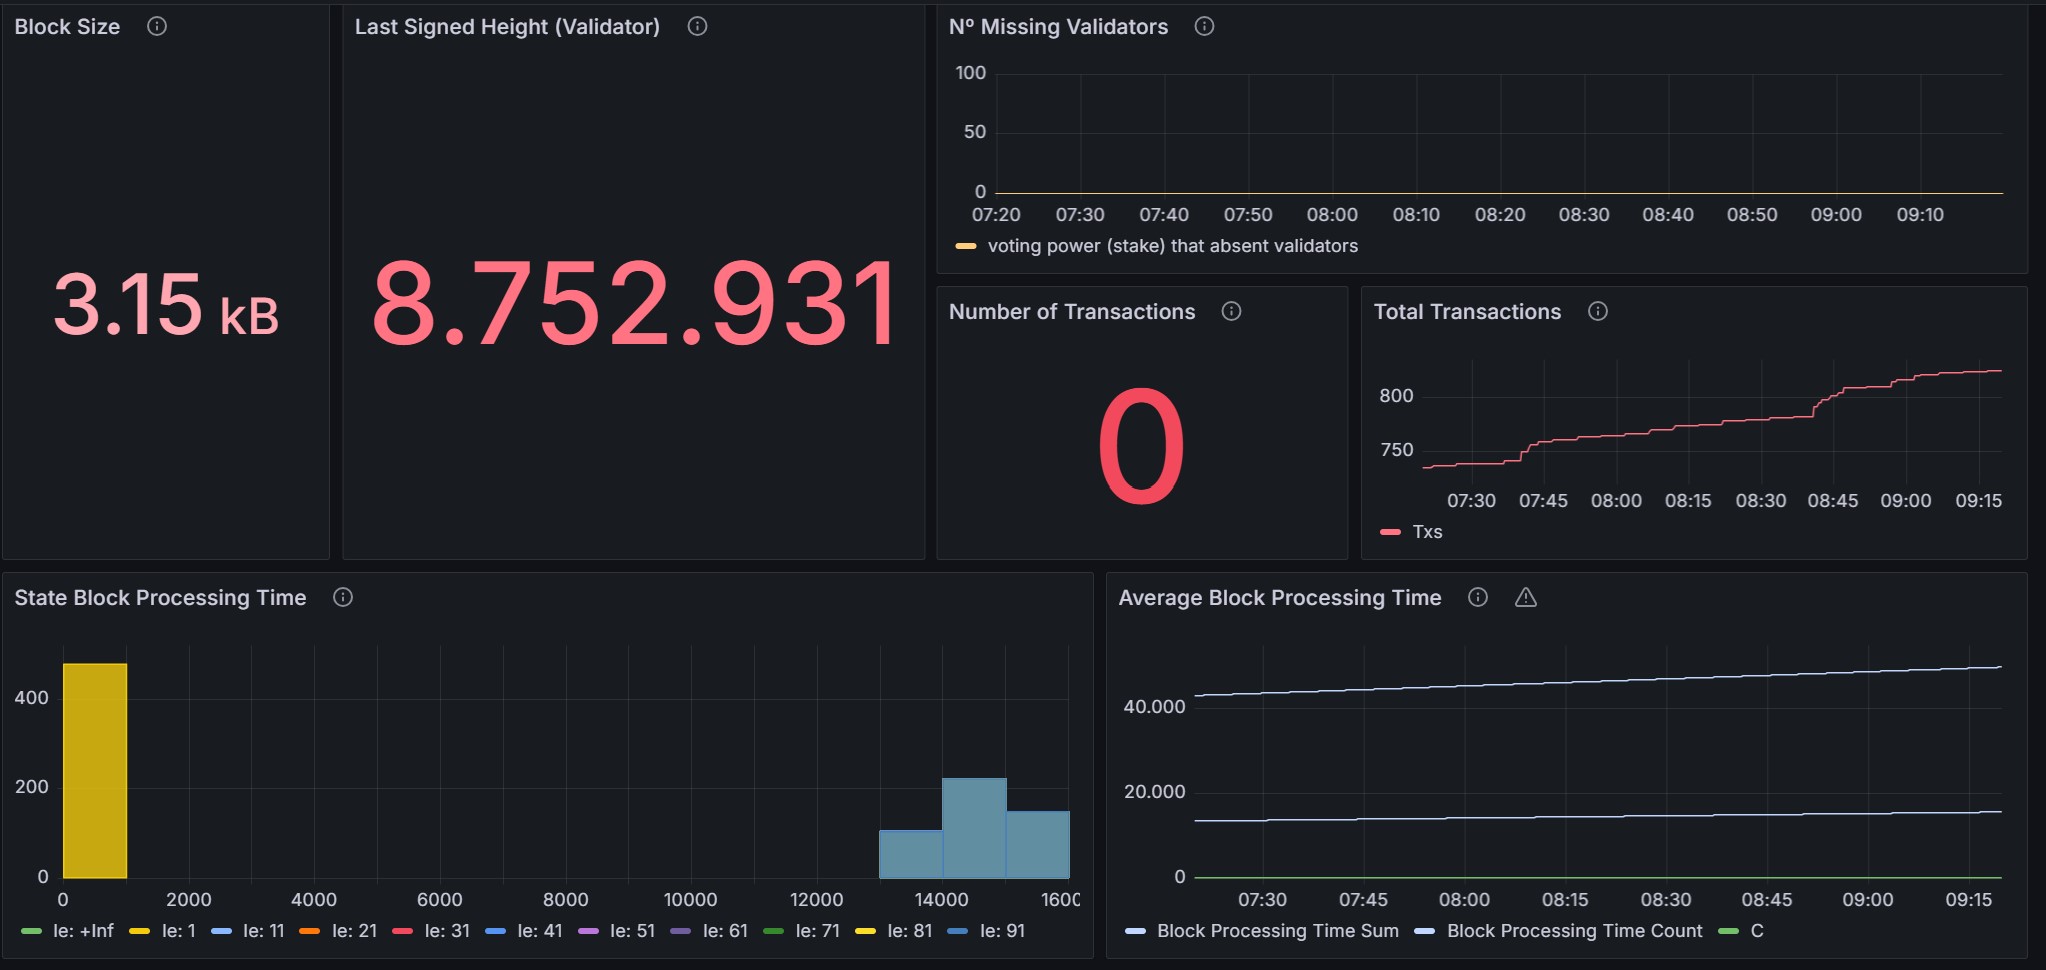
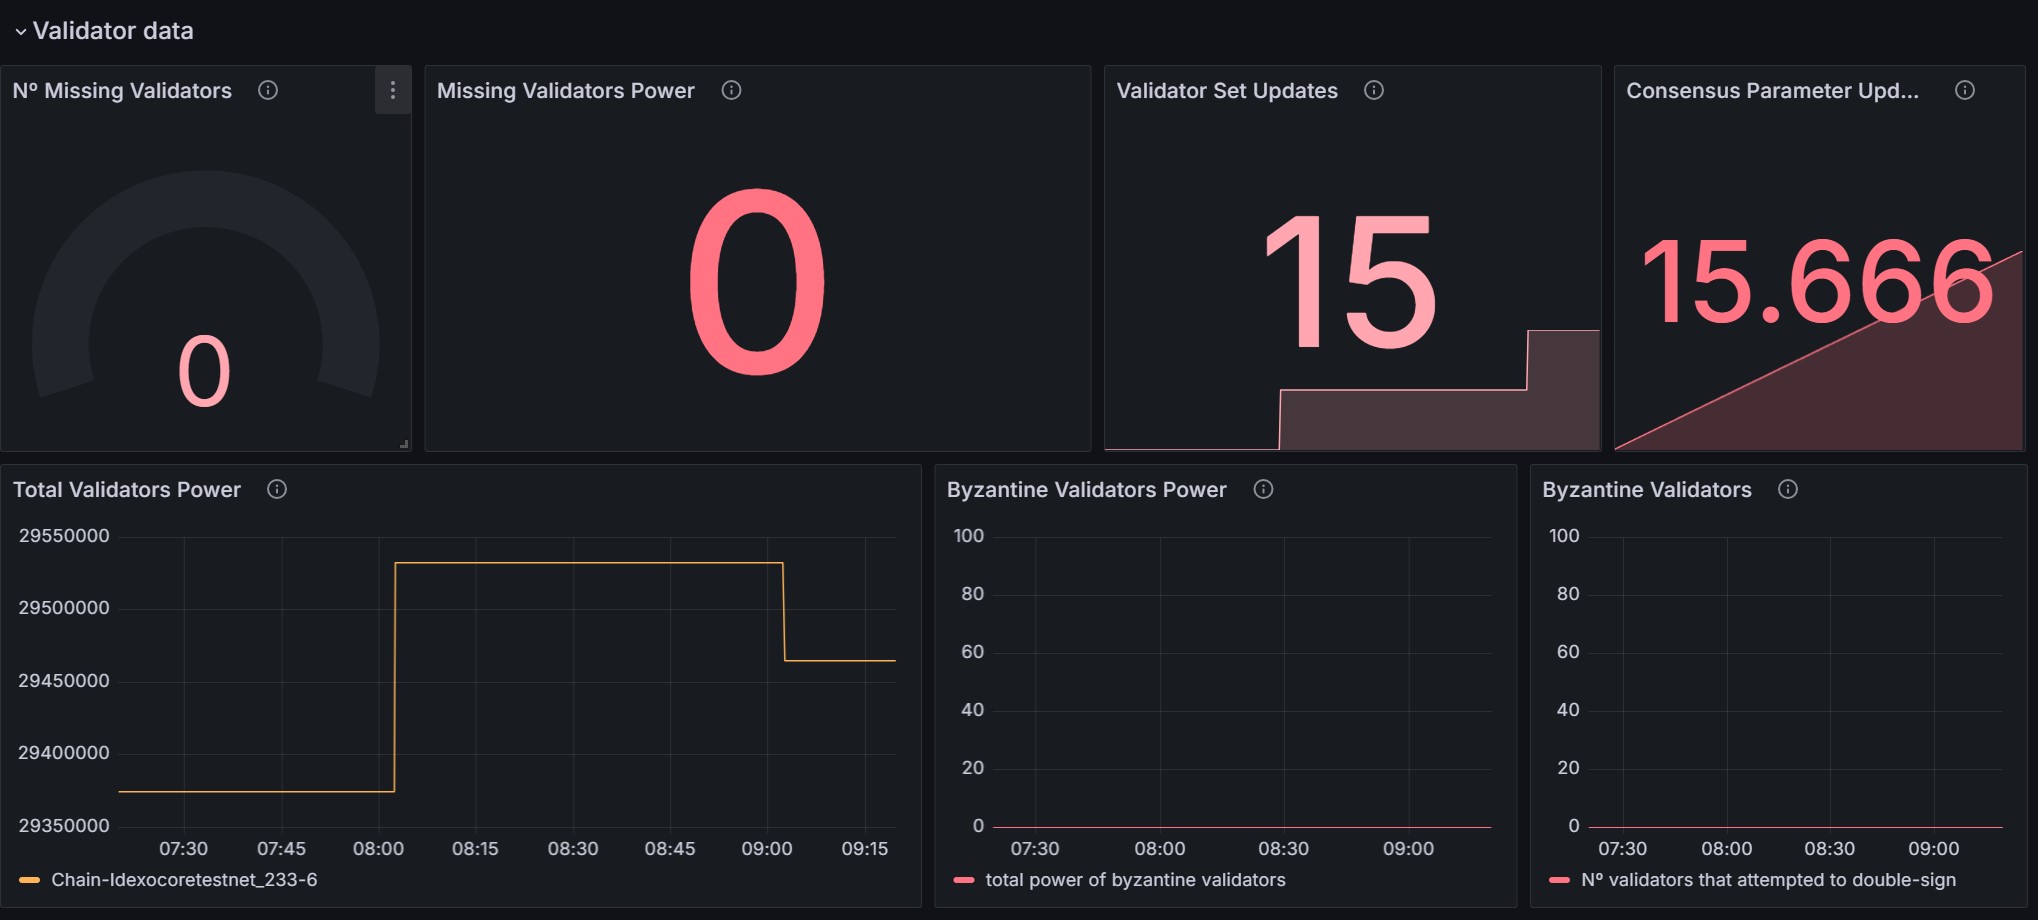
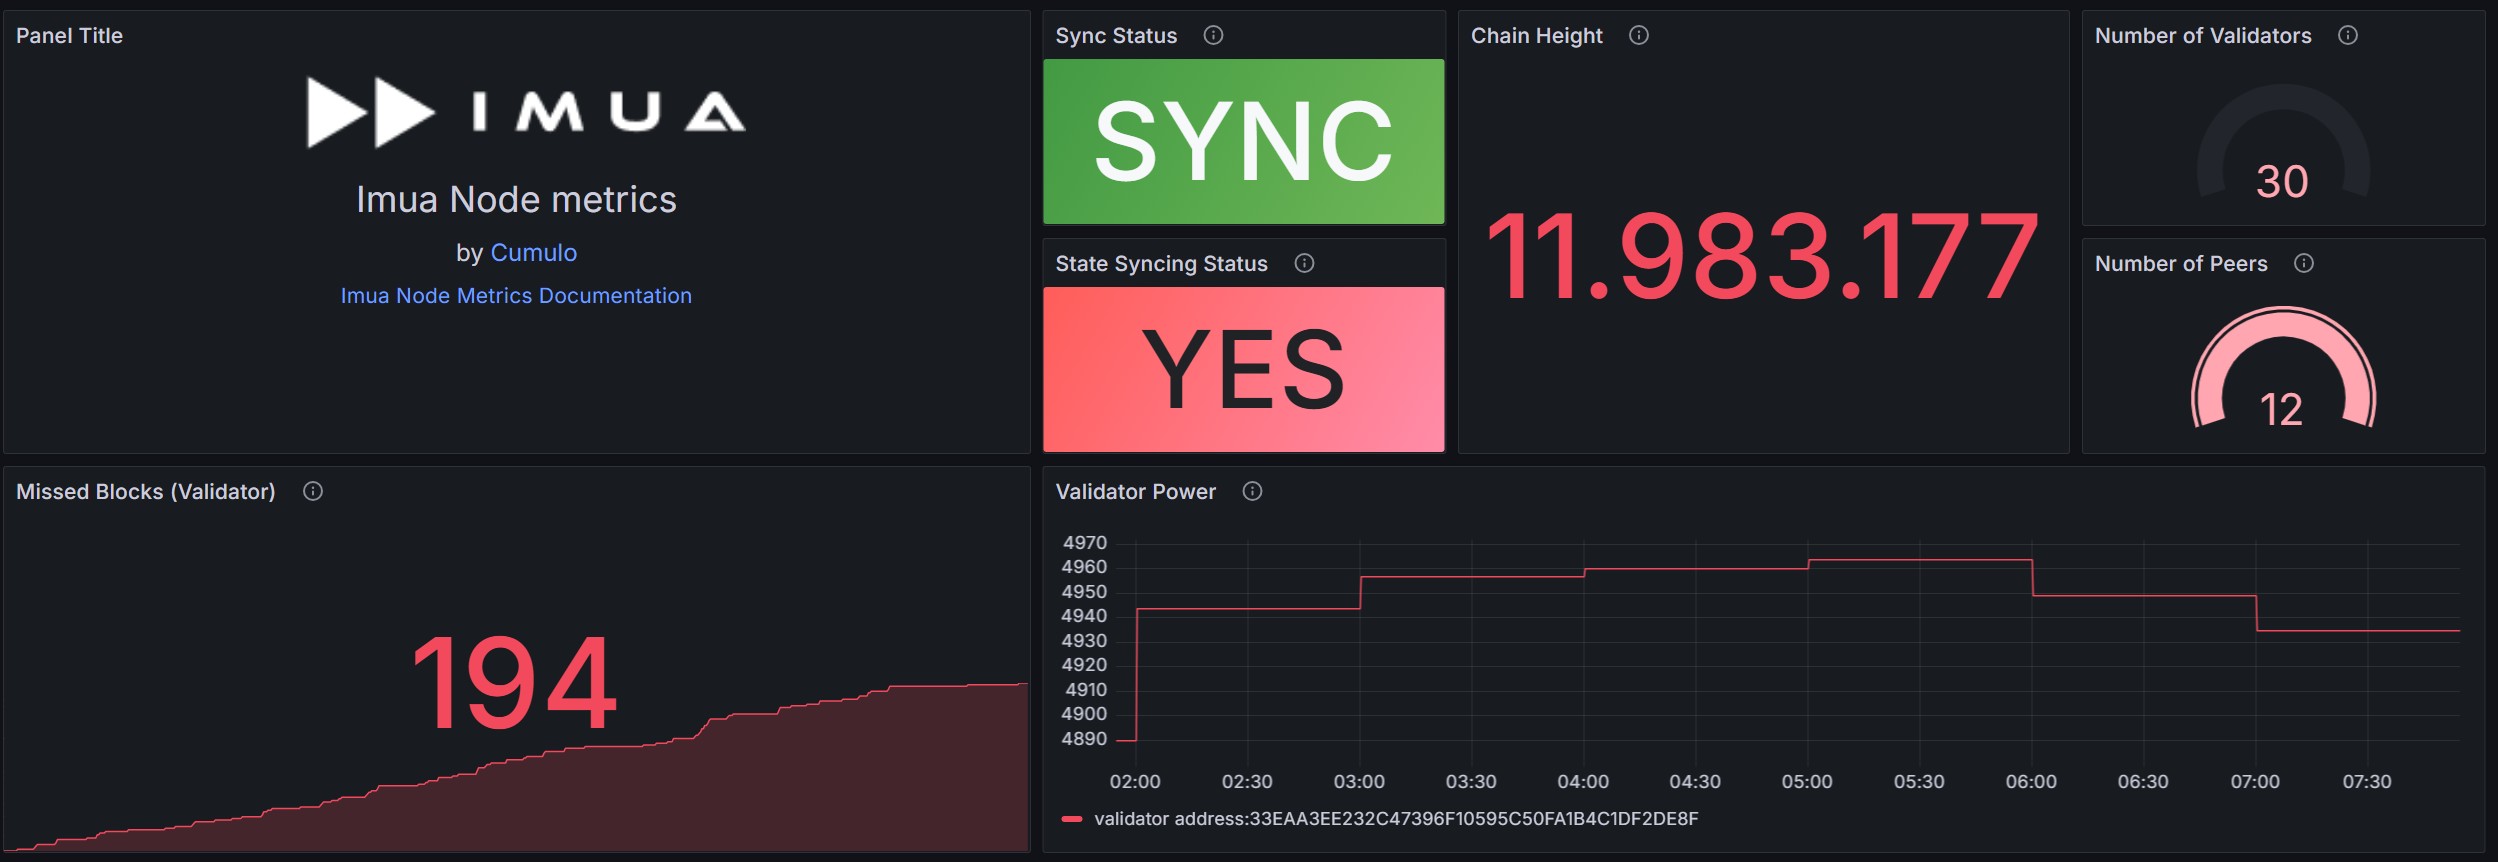
The Imua Dashboard by Cumulo dashboard uses the __expr__ and prometheus data sources to create a Grafana dashboard with the barchart, gauge, histogram, stat, text and timeseries panels.
Data source config
Collector type:
Collector plugins:
Collector config:
Revisions
Upload an updated version of an exported dashboard.json file from Grafana
| Revision | Description | Created | |
|---|---|---|---|
| Download |